Shaw 2015 Annual Report Download - page 60
Download and view the complete annual report
Please find page 60 of the 2015 Shaw annual report below. You can navigate through the pages in the report by either clicking on the pages listed below, or by using the keyword search tool below to find specific information within the annual report.-
 1
1 -
2
-
3
-
4
-
5
-
6
-
7
-
8
-
9
-
10
-
11
-
12
-
13
-
14
-
15
-
16
-
17
-
18
-
19
-
20
-
21
-
22
-
23
-
24
-
25
-
26
-
27
-
28
-
29
-
30
-
31
-
32
-
33
-
34
-
35
-
36
-
37
-
38
-
39
-
40
-
41
-
42
-
43
-
44
-
45
-
46
-
47
-
48
-
49
-
 50
50 -
 51
51 -
 52
52 -
 53
53 -
 54
54 -
 55
55 -
 56
56 -
 57
57 -
 58
58 -
 59
59 -
 60
60 -
 61
61 -
 62
62 -
 63
63 -
 64
64 -
 65
65 -
 66
66 -
 67
67 -
 68
68 -
 69
69 -
 70
70 -
71
-
72
-
73
-
74
-
75
-
76
-
77
-
78
-
79
-
80
-
81
-
82
-
83
-
84
-
85
-
86
-
87
-
88
-
89
-
90
-
91
-
92
-
93
-
94
-
95
-
96
-
97
-
98
-
99
-
100
-
101
-
102
-
103
-
104
-
105
-
106
-
107
-
108
-
109
-
110
 |
 |

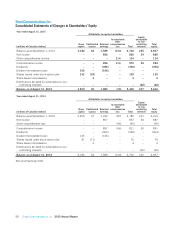
Shaw Communications Inc.
Consolidated Statements of Changes in Shareholders’ Equity
Year ended August 31, 2015
Attributable to equity shareholders
[millions of Canadian dollars]
Share
capital
Contributed
surplus
Retained
earnings
Accumulated
other
comprehensive
loss Total
Equity
attributable
to non-
controlling
interests
Total
equity
Balance as at September 1, 2014 3,182 64 1,589 (133) 4,702 235 4,937
Net income – – 856 – 856 24 880
Other comprehensive income – – – 114 114 – 114
Comprehensive income – – 856 114 970 24 994
Dividends – – (396) – (396) – (396)
Dividend reinvestment plan 166 – (166) – – – –
Shares issued under stock option plan 152 (23) – – 129 – 129
Share-based compensation –4 – – 4 – 4
Distributions declared by subsidiaries to non-
controlling interests – – – – – (22) (22)
Balance as at August 31, 2015 3,500 45 1,883 (19) 5,409 237 5,646
Year ended August 31, 2014
Attributable to equity shareholders
[millions of Canadian dollars]
Share
capital
Contributed
surplus
Retained
earnings
Accumulated
other
comprehensive
loss Total
Equity
attributable
to non-
controlling
interests
Total
equity
Balance as at September 1, 2013 2,955 72 1,242 (87) 4,182 231 4,413
Net income – – 857 – 857 30 887
Other comprehensive loss – – – (46) (46) – (46)
Comprehensive income – – 857 (46) 811 30 841
Dividends – – (364) – (364) – (364)
Dividend reinvestment plan 146 – (146) – – – –
Shares issued under stock option plan 81 (11) – – 70 – 70
Share-based compensation – 3 – – 3 – 3
Distributions declared by subsidiaries to non-
controlling interests – – – – – (26) (26)
Balance as at August 31, 2014 3,182 64 1,589 (133) 4,702 235 4,937
See accompanying notes
58 Shaw Communications Inc. 2015 Annual Report