Shaw 2015 Annual Report Download - page 25
Download and view the complete annual report
Please find page 25 of the 2015 Shaw annual report below. You can navigate through the pages in the report by either clicking on the pages listed below, or by using the keyword search tool below to find specific information within the annual report.-
 1
1 -
2
-
3
-
4
-
5
-
6
-
7
-
8
-
9
-
10
-
11
-
12
-
13
-
14
-
 15
15 -
 16
16 -
 17
17 -
 18
18 -
 19
19 -
 20
20 -
 21
21 -
 22
22 -
 23
23 -
 24
24 -
 25
25 -
 26
26 -
 27
27 -
 28
28 -
 29
29 -
 30
30 -
 31
31 -
 32
32 -
 33
33 -
 34
34 -
 35
35 -
36
-
37
-
38
-
39
-
40
-
41
-
42
-
43
-
44
-
45
-
46
-
47
-
48
-
49
-
50
-
51
-
52
-
53
-
54
-
55
-
56
-
57
-
58
-
59
-
60
-
61
-
62
-
63
-
64
-
65
-
66
-
67
-
68
-
69
-
70
-
71
-
72
-
73
-
74
-
75
-
76
-
77
-
78
-
79
-
80
-
81
-
82
-
83
-
84
-
85
-
86
-
87
-
88
-
89
-
90
-
91
-
92
-
93
-
94
-
95
-
96
-
97
-
98
-
99
-
100
-
101
-
102
-
103
-
104
-
105
-
106
-
107
-
108
-
109
-
110
 |
 |

Shaw Communications Inc.
Management’s Discussion and Analysis
August 31, 2015
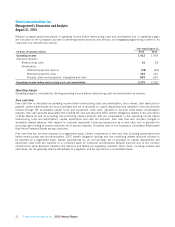
The Company uses free cash flow as a measure of the Company’s ability to repay debt and return cash to shareholders.
Consolidated free cash flow is calculated as follows:
Year ended August 31,
(millions of Canadian dollars) 2015 2014(3)
Revenue
Consumer 3,752 3,768
Business Network Services 520 484
Business Infrastructure Services 246 –
Media 1,080 1,096
5,598 5,348
Intersegment eliminations (110) (107)
5,488 5,241
Operating income before restructuring costs and amortization(1)
Consumer 1,686 1,669
Business Network Services 256 240
Business Infrastructure Services 95 –
Media 342 353
2,379 2,262
Capital expenditures and equipment costs (net):(2)
Consumer and Business Network Services 954 1,077
Business Infrastructure Services 152 –
Media 16 18
1,122 1,095
Accelerated Capital Fund Investment(1) (150) (240)
Total 972 855
Free cash flow before the following 1,407 1,407
Less
Interest (281) (264)
Cash taxes (375) (359)
Other adjustments:
Non-cash share-based compensation 43
CRTC benefit obligation funding (31) (58)
Non-controlling interests (26) (31)
Pension adjustment (45) (5)
Customer equipment financing 13 18
Preferred share dividends (13) (13)
Free cash flow 653 698
Operating margin(1)
Consumer 44.9% 44.3%
Business Network Services 49.2% 49.6%
Business Infrastructure Services 38.6% n/a
Media 31.7% 32.2%
(1) Refer to Key performance drivers.
(2) Per Note 24 to the audited Consolidated Financial Statements.
(3) Restated to reflect the change in segment reporting whereby residential and enterprise services that were
included in the Cable and Satellite segments are now realigned into new Consumer and Business Network
Services segments.
2015 Annual Report Shaw Communications Inc. 23