Shaw 2015 Annual Report Download - page 49
Download and view the complete annual report
Please find page 49 of the 2015 Shaw annual report below. You can navigate through the pages in the report by either clicking on the pages listed below, or by using the keyword search tool below to find specific information within the annual report.-
 1
1 -
2
-
3
-
4
-
5
-
6
-
7
-
8
-
9
-
10
-
11
-
12
-
13
-
14
-
15
-
16
-
17
-
18
-
19
-
20
-
21
-
22
-
23
-
24
-
25
-
26
-
27
-
28
-
29
-
30
-
31
-
32
-
33
-
34
-
35
-
36
-
37
-
38
-
 39
39 -
 40
40 -
 41
41 -
 42
42 -
 43
43 -
 44
44 -
 45
45 -
 46
46 -
 47
47 -
 48
48 -
 49
49 -
 50
50 -
 51
51 -
 52
52 -
 53
53 -
 54
54 -
 55
55 -
 56
56 -
 57
57 -
 58
58 -
 59
59 -
60
-
61
-
62
-
63
-
64
-
65
-
66
-
67
-
68
-
69
-
70
-
71
-
72
-
73
-
74
-
75
-
76
-
77
-
78
-
79
-
80
-
81
-
82
-
83
-
84
-
85
-
86
-
87
-
88
-
89
-
90
-
91
-
92
-
93
-
94
-
95
-
96
-
97
-
98
-
99
-
100
-
101
-
102
-
103
-
104
-
105
-
106
-
107
-
108
-
109
-
110
 |
 |

Shaw Communications Inc.
Management’s Discussion and Analysis
August 31, 2015
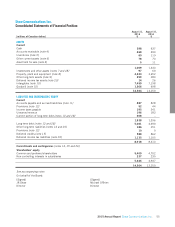
million in contributed surplus. Share capital increased due to the issuance of 11,865,236 Class B Non-Voting Shares under the
Company’s option plan and DRIP. As of November 15, 2015, share capital is as reported at August 31, 2015 with the
exception of the issuance of a total of 1,354,808 Class B Non-Voting Shares upon exercise of options under the Company’s
option plan and the DRIP. Retained earnings increased due to current year earnings of $856 million, partially offset by
dividends of $562 million. Accumulated other comprehensive loss decreased due to the net effect of exchange differences
arising on the translation of ViaWest and U.S. dollar denominated debt designated as a hedge of the Company’s net investment
in those foreign operations. Contributed surplus decreased due to the transfer of the fair value of options to share capital upon
exercise.
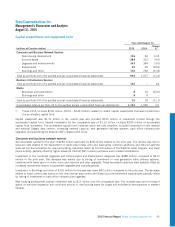
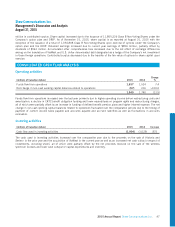
CONSOLIDATED CASH FLOW ANALYSIS
Operating activities
(millions of Canadian dollars) 2015 2014
Change
%
Funds flow from operations 1,637 1,524 7.4
Net change in non-cash working capital balances related to operations (97) 216 >100.0
1,540 1,740 (11.5)
Funds flow from operations increased over the last year primarily due to higher operating income before restructuring costs and
amortization, a decline in CRTC benefit obligation funding and lower expenditures on program rights and restructuring charges,
all of which were partially offset by an increase in funding of defined benefit pension plans and higher interest expense. The net
change in non-cash working capital balances related to operations fluctuated over the comparative periods due to the timing of
payment of current income taxes payable and accounts payable and accrued liabilities as well as fluctuations in accounts
receivable.
Investing activities
(millions of Canadian dollars) 2015 2014 Increase
Cash flow used in investing activities (1,904) (1,029) 875
The cash used in investing activities increased over the comparative year due to the proceeds on the sale of Historia and
Series+ in the prior year and the acquisition of ViaWest in the current year as well as an increased net cash outlay in respect of
investments, including shomi, all of which were partially offset by the net proceeds received on the sale of the wireless
spectrum licenses and lower cash outlays for capital expenditures and inventory.
2015 Annual Report Shaw Communications Inc. 47