Shaw 2015 Annual Report Download - page 39
Download and view the complete annual report
Please find page 39 of the 2015 Shaw annual report below. You can navigate through the pages in the report by either clicking on the pages listed below, or by using the keyword search tool below to find specific information within the annual report.-
 1
1 -
2
-
3
-
4
-
5
-
6
-
7
-
8
-
9
-
10
-
11
-
12
-
13
-
14
-
15
-
16
-
17
-
18
-
19
-
20
-
21
-
22
-
23
-
24
-
25
-
26
-
27
-
28
-
 29
29 -
 30
30 -
 31
31 -
 32
32 -
 33
33 -
 34
34 -
 35
35 -
 36
36 -
 37
37 -
 38
38 -
 39
39 -
 40
40 -
 41
41 -
 42
42 -
 43
43 -
 44
44 -
 45
45 -
 46
46 -
 47
47 -
 48
48 -
 49
49 -
50
-
51
-
52
-
53
-
54
-
55
-
56
-
57
-
58
-
59
-
60
-
61
-
62
-
63
-
64
-
65
-
66
-
67
-
68
-
69
-
70
-
71
-
72
-
73
-
74
-
75
-
76
-
77
-
78
-
79
-
80
-
81
-
82
-
83
-
84
-
85
-
86
-
87
-
88
-
89
-
90
-
91
-
92
-
93
-
94
-
95
-
96
-
97
-
98
-
99
-
100
-
101
-
102
-
103
-
104
-
105
-
106
-
107
-
108
-
109
-
110
 |
 |

Shaw Communications Inc.
Management’s Discussion and Analysis
August 31, 2015
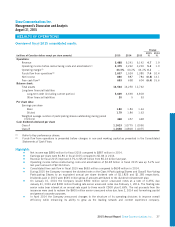
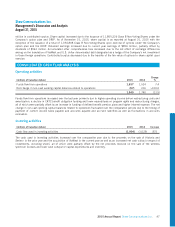
RESULTS OF OPERATIONS
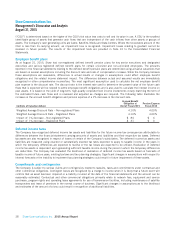
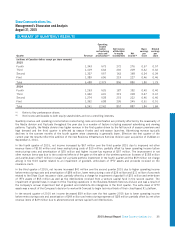
Overview of fiscal 2015 consolidated results
Change
(millions of Canadian dollars except per share amounts) 2015 2014 2013
2015
%
2014
%
Operations:
Revenue 5,488 5,241 5,142 4.7 1.9
Operating income before restructuring costs and amortization(1) 2,379 2,262 2,220 5.2 1.9
Operating margin(1) 43.3% 43.2% 43.2% 0.1 –
Funds flow from operations(2) 1,637 1,524 1,380 7.4 10.4
Net income 880 887 784 (0.8) 13.1
Free cash flow(1) 653 698 604 (6.4) 15.6
Balance sheet:
Total assets 14,564 13,250 12,732
Long-term financial liabilities
Long-term debt (including current portion) 5,669 4,690 4,818
Other financial liabilities 20 553
Per share data:
Earnings per share
Basic 1.80 1.84 1.64
Diluted 1.79 1.84 1.63
Weighted average number of participating shares outstanding during period
(millions) 468 457 448
Cash dividends declared per share
Class A 1.1613 1.0775 1.0050
Class B 1.1638 1.0800 1.0075
(1) Refer to Key performance drivers.
(2) Funds flow from operations is presented before changes in non-cash working capital as presented in the Consolidated
Statements of Cash Flows.
Highlights
ŠNet income was $880 million for fiscal 2015 compared to $887 million in 2014.
ŠEarnings per share were $1.80 in fiscal 2015 compared to $1.84 in 2014.
ŠRevenue for fiscal 2015 improved 4.7% to $5.49 billion from $5.24 billion last year.
ŠOperating income before restructuring costs and amortization of $2.38 billion in fiscal 2015 was up 5.2% over
last year’s amount of $2.26 billion.
ŠConsolidated free cash flow in fiscal 2015 was $653 million compared to $698 million in 2014.
ŠDuring 2015 the Company increased the dividend rate on the Class A Participating Shares and Class B Non-Voting
Participating Shares to an equivalent annual per share dividend rate of $1.1825 and $1.185 respectively.
Dividends paid in 2015 were $535 million gross of amounts attributed to the dividend reinvestment plan.
ŠOn January 31, 2014 the Company issued $500 million senior unsecured notes at a rate of 4.35% due
January 31, 2024 and $300 million floating rate senior unsecured notes due February 1, 2016. The floating rate
senior notes bear interest at an annual rate equal to three month CDOR plus 0.69%. The net proceeds from the
issuances were used to redeem the $600 million senior unsecured notes due June 2, 2014 and for working capital
and general corporate purposes.
ŠIn April 2014 the Company announced changes to the structure of its operating divisions to improve overall
efficiency while enhancing its ability to grow as the leading network and content experience company.
2015 Annual Report Shaw Communications Inc. 37