Quest Diagnostics 2003 Annual Report Download - page 76
Download and view the complete annual report
Please find page 76 of the 2003 Quest Diagnostics annual report below. You can navigate through the pages in the report by either clicking on the pages listed below, or by using the keyword search tool below to find specific information within the annual report.-
 1
1 -
2
-
3
-
4
-
5
-
6
-
7
-
8
-
9
-
10
-
11
-
12
-
13
-
14
-
15
-
16
-
17
-
18
-
19
-
20
-
21
-
22
-
23
-
24
-
25
-
26
-
27
-
28
-
29
-
30
-
31
-
32
-
33
-
34
-
35
-
36
-
37
-
38
-
39
-
40
-
41
-
42
-
43
-
44
-
45
-
46
-
47
-
48
-
49
-
50
-
51
-
52
-
53
-
54
-
55
-
56
-
57
-
58
-
59
-
60
-
61
-
62
-
63
-
64
-
65
-
 66
66 -
 67
67 -
 68
68 -
 69
69 -
 70
70 -
 71
71 -
 72
72 -
 73
73 -
 74
74 -
 75
75 -
 76
76 -
 77
77 -
 78
78 -
 79
79 -
 80
80 -
 81
81 -
 82
82 -
 83
83 -
 84
84 -
 85
85 -
 86
86 -
87
-
88
-
89
-
90
-
91
-
92
-
93
-
94
-
95
-
96
-
97
-
98
-
99
-
100
-
101
-
102
-
103
-
104
-
105
-
106
-
107
-
108
-
109
 |
 |

QUEST DIAGNOSTICS INCORPORATED AND SUBSIDIARIES
NOTES TO CONSOLIDATED FINANCIAL STATEMENTS—CONTINUED
(dollars in thousands unless otherwise indicated)
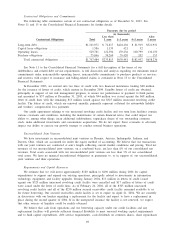
programs. Adjustments to the estimated receipts, based on final settlement with the third-party payers, are
recorded upon settlement. In 2003, 2002 and 2001, approximately 17%, 15% and 14%, respectively, of net
revenues were generated by Medicare and Medicaid programs. Under capitated agreements with health insurers,
the Company recognizes revenue based on a predetermined monthly contractual rate for each member of the
insurers’ health plan regardless of the number or cost of services provided by the Company.
Taxes on Income
The Company uses the asset and liability approach to account for income taxes. Under this method,
deferred tax assets and liabilities are recognized for the expected future tax consequences of differences between
the carrying amounts of assets and liabilities and their respective tax bases using tax rates in effect for the year
in which the differences are expected to reverse. The effect on deferred tax assets and liabilities of a change in
tax rates is recognized in income in the period when the change is enacted.
Earnings Per Share
On May 8, 2001, the stockholders approved an amendment to the Company’s restated certificate of
incorporation to increase the number of common shares authorized from 100 million shares to 300 million
shares. On May 31, 2001, the Company effected a two-for-one stock split through the issuance of a stock
dividend of one new share of common stock for each share of common stock held by stockholders of record
on May 16, 2001. References to the number of common shares and per common share amounts in the
accompanying consolidated statements of operations, including earnings per common share calculations and
related disclosures, have been restated to give retroactive effect to the stock split for all periods presented.
Basic earnings per common share is calculated by dividing net income, less preferred stock dividends ($30
per quarter in 2001), by the weighted average common shares outstanding. Diluted earnings per common share
is calculated by dividing net income, less preferred stock dividends, by the weighted average common shares
outstanding after giving effect to all potentially dilutive common shares outstanding during the period. The
if-converted method is used in determining the dilutive effect of the Company’s 1
3
⁄
4
% contingent convertible
debentures in periods when the holders of such securities are permitted to exercise their conversion rights (see
Note 11). Potentially dilutive common shares include outstanding stock options and restricted common shares
granted under the Company’s Employee Equity Participation Program. During the fourth quarter of 2001, the
Company redeemed all of its then issued and outstanding shares of preferred stock.
The computation of basic and diluted earnings per common share was as follows (in thousands, except per
share data):
2003 2002 2001
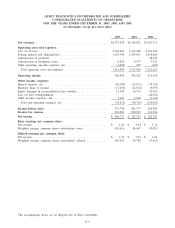
Net income ............................................. $436,717 $322,154 $162,303
Less: Preferred stock dividends .......................... - - 118
Net income available to common stockholders ............ $436,717 $322,154 $162,185
Weighted average common shares outstanding—basic ...... 103,416 96,467 93,053
Effect of dilutive securities:
Stock options ........................................... 2,343 2,879 3,854
Restricted common stock ................................ 173 444 703
Weighted average common shares outstanding—diluted .... 105,932 99,790 97,610
Basic earnings per common share:
Net income ............................................. $ 4.22 $ 3.34 $ 1.74
Diluted earnings per common share:
Net income ............................................. $ 4.12 $ 3.23 $ 1.66
F-7