Quest Diagnostics 2003 Annual Report Download - page 60
Download and view the complete annual report
Please find page 60 of the 2003 Quest Diagnostics annual report below. You can navigate through the pages in the report by either clicking on the pages listed below, or by using the keyword search tool below to find specific information within the annual report.-
 1
1 -
2
-
3
-
4
-
5
-
6
-
7
-
8
-
9
-
10
-
11
-
12
-
13
-
14
-
15
-
16
-
17
-
18
-
19
-
20
-
21
-
22
-
23
-
24
-
25
-
26
-
27
-
28
-
29
-
30
-
31
-
32
-
33
-
34
-
35
-
36
-
37
-
38
-
39
-
40
-
41
-
42
-
43
-
44
-
45
-
46
-
47
-
48
-
49
-
 50
50 -
 51
51 -
 52
52 -
 53
53 -
 54
54 -
 55
55 -
 56
56 -
 57
57 -
 58
58 -
 59
59 -
 60
60 -
 61
61 -
 62
62 -
 63
63 -
 64
64 -
 65
65 -
 66
66 -
 67
67 -
 68
68 -
 69
69 -
 70
70 -
71
-
72
-
73
-
74
-
75
-
76
-
77
-
78
-
79
-
80
-
81
-
82
-
83
-
84
-
85
-
86
-
87
-
88
-
89
-
90
-
91
-
92
-
93
-
94
-
95
-
96
-
97
-
98
-
99
-
100
-
101
-
102
-
103
-
104
-
105
-
106
-
107
-
108
-
109
 |
 |
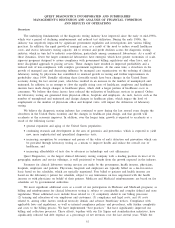
Isabel and the blackout in the third quarter of 2003 reduced testing volume by approximately 0.5% for the year
ended December 31, 2003. In addition, our drugs-of-abuse testing business, which is most directly impacted by
economic conditions and accounts for approximately 3% of our net revenues and 6% of our testing volume,
declined during 2003, reducing Company-wide testing volume growth by approximately 0.5%. Both reported and
pro forma testing volume have been impacted by general economic conditions, which have increased the number
of uninsured and unemployed and, we believe, have reduced utilization of healthcare services in 2003.
For the year ended December 31, 2003, average revenue per requisition improved 3.6%, or 5.1% on a pro
forma basis, assuming that the Unilab and AML acquisitions and the Divestiture had been completed on
January 1, 2002. These improvements in average revenue per requisition were primarily attributable to a
continuing shift in test mix to higher value testing, including gene-based and esoteric testing. Gene-based testing
net revenues exceeded $500 million for 2003, and grew over 20% compared to the prior year. In addition, a
shift in payer mix to higher priced fee-for-service reimbursement contributed a portion of the increase in
average revenue per requisition. The inclusion of Unilab’s results subsequent to February 28, 2003 served to
reduce average revenue per requisition, reflecting Unilab’s lower revenue per requisition.
Our businesses, other than clinical laboratory testing, which represent approximately 4% of our consolidated
net revenues, grew approximately 16% during the year and contributed about 0.5% to the reported growth in
net revenues.
Operating Costs and Expenses
Total operating costs and expenses for 2003 increased $426 million from 2002 primarily due to increases
in our clinical testing volume (largely as a result of the Unilab acquisition), employee compensation and
benefits, testing supply costs and depreciation expense. While our cost structure has been favorably impacted by
the improved efficiencies generated from our Six Sigma and standardization initiatives, we continue to make
investments to enhance our infrastructure to pursue our overall business strategy. These investments include:
•Skills training for all employees, which together with our competitive pay and benefits, helps to increase
employee satisfaction and performance, which we believe will result in better service to our customers;
•Our information technology strategy, which is designed to improve our efficiency and provide better
service to our customers; and
•Our strategic growth opportunities.
Cost of services, which includes the costs of obtaining, transporting and testing specimens, was 58.4% of
net revenues for 2003, compared to 59.2% in the prior year. This improvement was primarily the result of
efficiency gains resulting from our Six Sigma and standardization initiatives and the increase in average revenue
per requisition. This improvement was partially offset by initial installation costs of deploying our Internet-based
orders and results systems in physicians’ offices and our patient service centers. The increase in the number of
orders and test results reported via our Internet-based systems is improving the initial collection of billing
information which is reducing the cost of billing and bad debt expense, both of which are components of
selling, general and administrative expenses. At December 31, 2003, approximately 25% of our orders and
approximately 35% of our test results were being transmitted via the Internet. Additionally, we are seeing an
increase in the number of physicians who no longer draw blood in their office, which is resulting in an increase
in the number of blood draws in our patient service centers or by our phlebotomists placed in physicians’
offices. This shift has increased our operating costs associated with our blood draws, but is reducing costs in
accessioning and other parts of our operations due to improved billing information and a reduction in the
number of inadequate patient samples obtained by our trained phlebotomists compared to samples collected by
physician employed phlebotomists.
Selling, general and administrative expenses, which include the costs of the sales force, billing operations,
bad debt expense and general management and administrative support, decreased during 2003, as a percentage
of net revenues, to 24.6% from 26.2% in the prior year. This improvement was primarily due to efficiencies
from our Six Sigma and standardization initiatives and the improvement in average revenue per requisition.
During 2003, bad debt expense improved to 4.8% of net revenues, compared to 5.3% in 2002. The reduction in
bad debt expense as a percentage of net revenues occurred despite the addition of Unilab, which has higher
levels of bad debt than the rest of Quest Diagnostics. This improvement primarily relates to the collection of
diagnosis, patient and insurance information necessary to more effectively bill for services performed. We
believe that our Six Sigma and standardization initiatives and the increased use of electronic ordering by our
customers will provide additional opportunities to further improve our overall collection experience and cost
structure.
43