Quest Diagnostics 2003 Annual Report Download - page 62
Download and view the complete annual report
Please find page 62 of the 2003 Quest Diagnostics annual report below. You can navigate through the pages in the report by either clicking on the pages listed below, or by using the keyword search tool below to find specific information within the annual report.-
 1
1 -
2
-
3
-
4
-
5
-
6
-
7
-
8
-
9
-
10
-
11
-
12
-
13
-
14
-
15
-
16
-
17
-
18
-
19
-
20
-
21
-
22
-
23
-
24
-
25
-
26
-
27
-
28
-
29
-
30
-
31
-
32
-
33
-
34
-
35
-
36
-
37
-
38
-
39
-
40
-
41
-
42
-
43
-
44
-
45
-
46
-
47
-
48
-
49
-
50
-
51
-
 52
52 -
 53
53 -
 54
54 -
 55
55 -
 56
56 -
 57
57 -
 58
58 -
 59
59 -
 60
60 -
 61
61 -
 62
62 -
 63
63 -
 64
64 -
 65
65 -
 66
66 -
 67
67 -
 68
68 -
 69
69 -
 70
70 -
 71
71 -
 72
72 -
73
-
74
-
75
-
76
-
77
-
78
-
79
-
80
-
81
-
82
-
83
-
84
-
85
-
86
-
87
-
88
-
89
-
90
-
91
-
92
-
93
-
94
-
95
-
96
-
97
-
98
-
99
-
100
-
101
-
102
-
103
-
104
-
105
-
106
-
107
-
108
-
109
 |
 |
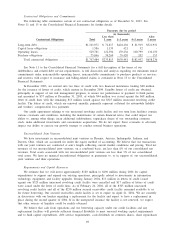
goodwill and bad debt expense. While our cost structure has been favorably impacted by the synergies realized
as a result of the integration of SBCL and the improved efficiencies generated from our Six Sigma and
standardization initiatives, we continue to make investments to enhance our infrastructure to pursue our overall
business strategy. These investments include those related to:
•Skills training for all employees, which together with our competitive pay and benefits, helps to increase
employee satisfaction and performance, which we believe will result in better service to our customers;
•Our information technology strategy, which is designed to improve our efficiency and provide better
service to our customers; and
•Our strategic growth opportunities.
Cost of services, which includes the costs of obtaining, transporting and testing specimens, was 59.2% of
net revenues for the year ended December 31, 2002, decreasing slightly from 59.3% in the prior year. The
positive impact of our Six Sigma and standardization initiatives and the increase in average revenue per
requisition, which reduced cost of services as a percentage of net revenues, was partially offset by the addition
of AML’s higher cost of services as of April 1, 2002. Cost of services has also increased due to a greater
percentage of patients having their blood drawn in our patient service centers or by our phlebotomists placed in
physicians’ offices. During 2002, in an effort to reduce their costs, many physicians took action to simplify
activities in their offices by ceasing blood draws by physician staff. Additionally, reflected in the cost of
services are the one-time installation costs of deploying our Internet-based orders and results systems in
physicians’ offices. As of December 31, 2002, approximately 10% of all orders and 15% of all test results were
being transmitted via the Internet. Both the reduction of blood draws in the physicians’ offices and the
increased use of the Internet for ordering and resulting are improving the initial collection of billing information
and generating savings in the cost of billing and bad debt expense, both of which are components of selling,
general and administrative expense. Increased blood draws by Company-trained employee phlebotomists also
improve the overall preparation of the blood sample, which can improve efficiency of the testing process.
Selling, general and administrative expenses, which include the costs of the sales force, billing operations,
bad debt expense and general management and administrative support, decreased during the year ended
December 31, 2002 as a percentage of net revenues to 26.2% from 28.1% in the prior year. This decrease was
primarily due to efficiencies from our Six Sigma and standardization initiatives, in particular bad debt expense,
the improvement in average revenue per requisition and the impact of AML’s cost structure as of April 1, 2002.
During 2002, bad debt expense improved to 5.3% of net revenues, compared to 6.0% of net revenues in 2001.
The improvements in bad debt expense were principally attributable to the continued progress that we have
made in our overall collection experience through process improvements, driven by our Six Sigma and
standardization initiatives. These improvements primarily relate to the collection of diagnosis, patient and
insurance information necessary to effectively bill for services performed. We believe that our Six Sigma and
standardization initiatives will provide additional opportunities to further improve our overall collection
experience.
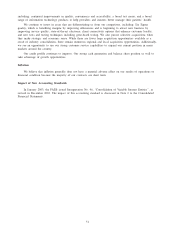
Amortization of goodwill for the year ended December 31, 2002 decreased from the prior year by $38
million as the result of adopting SFAS 142, effective January 1, 2002. See Note 2 to the Consolidated Financial
Statements for further details regarding the impact of SFAS 142.
Other operating (income) expense, net represents miscellaneous income and expense items related to
operating activities, such as gains and losses associated with the disposal of operating assets.
Operating Income
Operating income for the year ended December 31, 2002 improved to $592 million, or 14.4% of net
revenues, from $412 million, or 11.3% of net revenues, in 2001. The increase in operating income was
primarily due to revenue growth, improved efficiencies generated from our Six Sigma and standardization
initiatives and a reduction in amortization of goodwill, partially offset by increases in employee compensation
and supply costs, depreciation expense and investments in our information technology strategy and strategic
growth opportunities.
Other Income (Expense)
Net interest expense for the year ended December 31, 2002 decreased from the prior year by $17 million.
The reduction was primarily due to the favorable impact of our debt refinancings in 2001 and a favorable
interest rate environment.
45