Quest Diagnostics 2003 Annual Report Download - page 103
Download and view the complete annual report
Please find page 103 of the 2003 Quest Diagnostics annual report below. You can navigate through the pages in the report by either clicking on the pages listed below, or by using the keyword search tool below to find specific information within the annual report.-
 1
1 -
2
-
3
-
4
-
5
-
6
-
7
-
8
-
9
-
10
-
11
-
12
-
13
-
14
-
15
-
16
-
17
-
18
-
19
-
20
-
21
-
22
-
23
-
24
-
25
-
26
-
27
-
28
-
29
-
30
-
31
-
32
-
33
-
34
-
35
-
36
-
37
-
38
-
39
-
40
-
41
-
42
-
43
-
44
-
45
-
46
-
47
-
48
-
49
-
50
-
51
-
52
-
53
-
54
-
55
-
56
-
57
-
58
-
59
-
60
-
61
-
62
-
63
-
64
-
65
-
66
-
67
-
68
-
69
-
70
-
71
-
72
-
73
-
74
-
75
-
76
-
77
-
78
-
79
-
80
-
81
-
82
-
83
-
84
-
85
-
86
-
87
-
88
-
89
-
90
-
91
-
92
-
 93
93 -
 94
94 -
 95
95 -
 96
96 -
 97
97 -
 98
98 -
 99
99 -
 100
100 -
 101
101 -
 102
102 -
 103
103 -
 104
104 -
 105
105 -
 106
106 -
 107
107 -
 108
108 -
 109
109
 |
 |

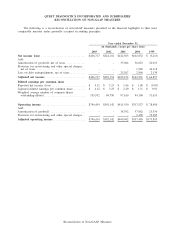
QUEST DIAGNOSTICS INCORPORATED AND SUBSIDIARIES
NOTES TO CONSOLIDATED FINANCIAL STATEMENTS—CONTINUED
(dollars in thousands unless otherwise indicated)
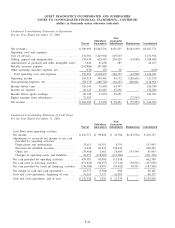
Condensed Consolidating Statement of Operations
For the Year Ended December 31, 2001 Non-
Subsidiary Guarantor
Parent Guarantors Subsidiaries Eliminations Consolidated
Net revenues ....................................... $ 596,909 $2,862,536 $451,525 $(283,199) $3,627,771
Operating costs and expenses:
Cost of services .................................... 431,382 1,610,902 109,310 - 2,151,594
Selling, general and administrative ................... 159,439 623,419 250,420 (14,598) 1,018,680
Amortization of goodwill and other intangible assets 3,826 41,696 585 - 46,107
Royalty (income) expense ........................... (241,886) 241,886 - - -
Other operating (income) expense, net ............... (370) 172 38 - (160)
Total operating costs and expenses ................ 352,391 2,518,075 360,353 (14,598) 3,216,221
Operating income .................................. 244,518 344,461 91,172 (268,601) 411,550
Non-operating expenses, net ......................... (88,375) (268,762) (26,425) 268,601 (114,961)
Income before taxes ................................ 156,143 75,699 64,747 - 296,589
Income tax expense ................................ 66,345 42,645 25,296 - 134,286
Income before equity earnings ...................... 89,798 33,054 39,451 - 162,303
Equity earnings from subsidiaries .................... 72,505 - - (72,505) -
Net income ........................................ $ 162,303 $ 33,054 $ 39,451 $ (72,505) $ 162,303
Condensed Consolidating Statement of Cash Flows
For the Year Ended December 31, 2003 Non-
Subsidiary Guarantor
Parent Guarantors Subsidiaries Eliminations Consolidated
Cash flows from operating activities:
Net income ...................................... $ 436,717 $ 99,808 $ 43,786 $(143,594) $ 436,717
Adjustments to reconcile net income to net cash
provided by operating activities:
Depreciation and amortization ................... 53,611 91,501 8,791 - 153,903
Provision for doubtful accounts ................. 4,944 64,835 158,443 - 228,222
Other, net ..................................... (78,968) 2,463 18,604 143,594 85,693
Changes in operating assets and liabilities ....... 54,277 (178,027) (117,986) - (241,736)
Net cash provided by operating activities .......... 470,581 80,580 111,638 - 662,799
Net cash used in investing activities ............... (271,820) (96,957) (17,342) (30,931) (417,050)
Net cash provided by (used in) financing activities (136,188) 10,991 (93,302) 30,931 (187,568)
Net change in cash and cash equivalents........... 62,573 (5,386) 994 - 58,181
Cash and cash equivalents, beginning of year ...... 79,015 7,377 10,385 - 96,777
Cash and cash equivalents, end of year ............ $ 141,588 $ 1,991 $ 11,379 $ - $ 154,958
F-34