Quest Diagnostics 2003 Annual Report Download - page 61
Download and view the complete annual report
Please find page 61 of the 2003 Quest Diagnostics annual report below. You can navigate through the pages in the report by either clicking on the pages listed below, or by using the keyword search tool below to find specific information within the annual report.-
 1
1 -
2
-
3
-
4
-
5
-
6
-
7
-
8
-
9
-
10
-
11
-
12
-
13
-
14
-
15
-
16
-
17
-
18
-
19
-
20
-
21
-
22
-
23
-
24
-
25
-
26
-
27
-
28
-
29
-
30
-
31
-
32
-
33
-
34
-
35
-
36
-
37
-
38
-
39
-
40
-
41
-
42
-
43
-
44
-
45
-
46
-
47
-
48
-
49
-
50
-
 51
51 -
 52
52 -
 53
53 -
 54
54 -
 55
55 -
 56
56 -
 57
57 -
 58
58 -
 59
59 -
 60
60 -
 61
61 -
 62
62 -
 63
63 -
 64
64 -
 65
65 -
 66
66 -
 67
67 -
 68
68 -
 69
69 -
 70
70 -
 71
71 -
72
-
73
-
74
-
75
-
76
-
77
-
78
-
79
-
80
-
81
-
82
-
83
-
84
-
85
-
86
-
87
-
88
-
89
-
90
-
91
-
92
-
93
-
94
-
95
-
96
-
97
-
98
-
99
-
100
-
101
-
102
-
103
-
104
-
105
-
106
-
107
-
108
-
109
 |
 |
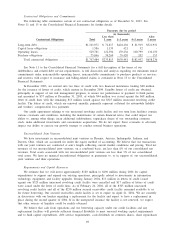
Other operating (income) expense, net represents miscellaneous income and expense items related to
operating activities, and includes gains and losses associated with the disposal of operating assets.
Operating Income
Operating income for the year ended December 31, 2003 improved to $796 million, or 16.8% of net
revenues, from $592 million, or 14.4% of net revenues, in 2002. The increase in operating income was
primarily due to revenue growth and improved efficiencies generated from our Six Sigma and standardization
initiatives.
Other Income (Expense)
Net interest expense for the year ended December 31, 2003 increased from 2002 by $6 million and was
primarily attributable to the amounts borrowed to finance the acquisition of Unilab and to repay substantially all
of Unilab’s outstanding debt, partially offset by decreased amounts borrowed under our secured receivables
credit facility.
Other income (expense), net represents miscellaneous income and expense items related to non-operating
activities such as gains and losses associated with investments and other non-operating assets.
Year Ended December 31, 2002 Compared with Year Ended December 31, 2001
Net income for the year ended December 31, 2002 increased to $322 million from $162 million for the
year ended December 31, 2001. Assuming that the provisions of SFAS 142 related to accounting for goodwill
amortization had been in effect in 2001, net income for the year ended December 31, 2001 would have been
$198 million. The increase in earnings was primarily attributable to revenue growth, improved efficiencies
generated from our Six Sigma and standardization initiatives, and a reduction in net interest expense, partially
offset by increases in employee compensation and supply costs, depreciation expense and investments in our
information technology strategy and strategic growth opportunities. In addition, results for the year ended
December 31, 2001 included a loss on debt extinguishment of $42 million, which was incurred in conjunction
with our debt refinancing in the second quarter of 2001.
Net Revenues
Net revenues for the year ended December 31, 2002 grew by 13.2% compared with the prior year. The
acquisition of AML, which was completed on April 1, 2002, contributed approximately one-half of the increase
in net revenues. For the year ended December 31, 2002, clinical testing volume, measured by the number of
requisitions, increased 9.7% compared with the prior year. Assuming AML had been part of Quest Diagnostics
in 2001, clinical testing volume would have increased above the prior year level by 3.4% on a pro forma basis.
Other smaller acquisitions completed in 2001 contributed approximately 1.5% to testing volume growth in 2002.
Partially offsetting these increases was a decline in testing volumes associated with our drugs of abuse testing
business, which reduced total Company testing volume for the year ended December 31, 2002 by about one-half
of a percent. Drugs of abuse testing, which accounted for approximately 7% of our testing volume and 4% of
our net revenues, was impacted by a general slowing of the economy and a corresponding slowdown in hiring.
Average revenue per requisition increased 3.2% for the year ended December 31, 2002, compared with the prior
year. The improvement in average revenue per requisition was primarily attributable to a continuing shift in test
mix to higher value testing, including gene-based testing, which contributed over one-half of the improvement,
and a shift in payer mix to higher priced fee-for-service reimbursement. We continued to see strong growth in
our gene-based and esoteric testing with gene-based testing net revenues, which approached $400 million for the
year, growing at more than 20% compared with the prior year. Our businesses, other than clinical laboratory
testing, which accounted for approximately 4% of our total net revenues in 2002, grew about 15% over the
prior year and accounted for 0.6% of the 13.2% increase in net revenues, or approximately $20 million. Most
of this increase was from our MedPlus subsidiary, which we acquired in November 2001, which develops
clinical connectivity products designed to enhance patient care.
Operating Costs and Expenses
Total operating costs for the year ended December 31, 2002 increased $300 million from the prior year
primarily due to increases in our clinical testing volume, largely as a result of the AML acquisition, employee
compensation and supply costs and depreciation expense; partially offset by reductions in amortization of
44