Quest Diagnostics 2003 Annual Report Download - page 72
Download and view the complete annual report
Please find page 72 of the 2003 Quest Diagnostics annual report below. You can navigate through the pages in the report by either clicking on the pages listed below, or by using the keyword search tool below to find specific information within the annual report.-
 1
1 -
2
-
3
-
4
-
5
-
6
-
7
-
8
-
9
-
10
-
11
-
12
-
13
-
14
-
15
-
16
-
17
-
18
-
19
-
20
-
21
-
22
-
23
-
24
-
25
-
26
-
27
-
28
-
29
-
30
-
31
-
32
-
33
-
34
-
35
-
36
-
37
-
38
-
39
-
40
-
41
-
42
-
43
-
44
-
45
-
46
-
47
-
48
-
49
-
50
-
51
-
52
-
53
-
54
-
55
-
56
-
57
-
58
-
59
-
60
-
61
-
 62
62 -
 63
63 -
 64
64 -
 65
65 -
 66
66 -
 67
67 -
 68
68 -
 69
69 -
 70
70 -
 71
71 -
 72
72 -
 73
73 -
 74
74 -
 75
75 -
 76
76 -
 77
77 -
 78
78 -
 79
79 -
 80
80 -
 81
81 -
 82
82 -
83
-
84
-
85
-
86
-
87
-
88
-
89
-
90
-
91
-
92
-
93
-
94
-
95
-
96
-
97
-
98
-
99
-
100
-
101
-
102
-
103
-
104
-
105
-
106
-
107
-
108
-
109
 |
 |

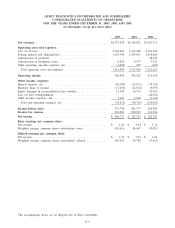
QUEST DIAGNOSTICS INCORPORATED AND SUBSIDIARIES
CONSOLIDATED STATEMENTS OF OPERATIONS
FOR THE YEARS ENDED DECEMBER 31, 2003, 2002 AND 2001
(in thousands, except per share data)
2003 2002 2001
Net revenues ........................................................ $4,737,958 $4,108,051 $3,627,771
Operating costs and expenses:
Cost of services ..................................................... 2,768,623 2,432,388 2,151,594
Selling, general and administrative .................................... 1,165,700 1,074,841 1,018,680
Amortization of goodwill ............................................. - - 38,392
Amortization of intangible assets ...................................... 8,201 8,373 7,715
Other operating (income) expense, net ................................. (1,020) 307 (160)
Total operating costs and expenses .................................. 3,941,504 3,515,909 3,216,221
Operating income ................................................... 796,454 592,142 411,550
Other income (expense):
Interest expense, net ................................................. (59,789) (53,673) (70,523)
Minority share of income ............................................ (17,630) (14,874) (9,953)
Equity earnings in unconsolidated joint ventures ....................... 17,439 16,714 10,763
Loss on debt extinguishment.......................................... - - (42,012)
Other income (expense), net .......................................... 1,324 2,068 (3,236)
Total non-operating expenses, net ................................... (58,656) (49,765) (114,961)
Income before taxes................................................. 737,798 542,377 296,589
Income tax expense ................................................. 301,081 220,223 134,286
Net income ......................................................... $ 436,717 $ 322,154 $ 162,303
Basic earnings per common share:
Net income .......................................................... $ 4.22 $ 3.34 $ 1.74
Weighted average common shares outstanding—basic................... 103,416 96,467 93,053
Diluted earnings per common share:
Net income .......................................................... $ 4.12 $ 3.23 $ 1.66
Weighted average common shares outstanding—diluted ................. 105,932 99,790 97,610
The accompanying notes are an integral part of these statements.
F-3