Quest Diagnostics 2003 Annual Report Download - page 73
Download and view the complete annual report
Please find page 73 of the 2003 Quest Diagnostics annual report below. You can navigate through the pages in the report by either clicking on the pages listed below, or by using the keyword search tool below to find specific information within the annual report.-
 1
1 -
2
-
3
-
4
-
5
-
6
-
7
-
8
-
9
-
10
-
11
-
12
-
13
-
14
-
15
-
16
-
17
-
18
-
19
-
20
-
21
-
22
-
23
-
24
-
25
-
26
-
27
-
28
-
29
-
30
-
31
-
32
-
33
-
34
-
35
-
36
-
37
-
38
-
39
-
40
-
41
-
42
-
43
-
44
-
45
-
46
-
47
-
48
-
49
-
50
-
51
-
52
-
53
-
54
-
55
-
56
-
57
-
58
-
59
-
60
-
61
-
62
-
 63
63 -
 64
64 -
 65
65 -
 66
66 -
 67
67 -
 68
68 -
 69
69 -
 70
70 -
 71
71 -
 72
72 -
 73
73 -
 74
74 -
 75
75 -
 76
76 -
 77
77 -
 78
78 -
 79
79 -
 80
80 -
 81
81 -
 82
82 -
 83
83 -
84
-
85
-
86
-
87
-
88
-
89
-
90
-
91
-
92
-
93
-
94
-
95
-
96
-
97
-
98
-
99
-
100
-
101
-
102
-
103
-
104
-
105
-
106
-
107
-
108
-
109
 |
 |

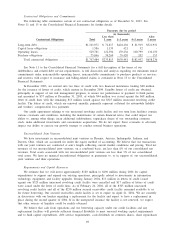
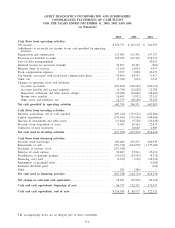
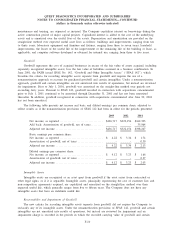
QUEST DIAGNOSTICS INCORPORATED AND SUBSIDIARIES
CONSOLIDATED STATEMENTS OF CASH FLOWS
FOR THE YEARS ENDED DECEMBER 31, 2003, 2002 AND 2001
(in thousands)
2003 2002 2001
Cash flows from operating activities:
Net income ........................................................... $ 436,717 $ 322,154 $ 162,303
Adjustments to reconcile net income to net cash provided by operating
activities:
Depreciation and amortization .......................................... 153,903 131,391 147,727
Provision for doubtful accounts ........................................ 228,222 217,360 218,271
Loss on debt extinguishment ........................................... - - 42,012
Deferred income tax provision (benefit)................................. 33,853 90,401 (560)
Minority share of income .............................................. 17,630 14,874 9,953
Stock compensation expense ........................................... 5,297 9,028 20,672
Tax benefits associated with stock-based compensation plans ............. 30,496 44,507 71,917
Other, net ............................................................ (1,583) (813) 1,034
Changes in operating assets and liabilities:
Accounts receivable ................................................. (254,865) (168,185) (230,131)
Accounts payable and accrued expenses .............................. (6,795) (12,658) 12,788
Integration, settlement and other special charges ...................... (18,942) (29,668) (48,664)
Income taxes payable ............................................... 26,493 (3,912) 23,131
Other assets and liabilities, net ...................................... 12,373 (18,108) 35,350
Net cash provided by operating activities ............................. 662,799 596,371 465,803
Cash flows from investing activities:
Business acquisitions, net of cash acquired ............................. (237,610) (333,512) (152,864)
Capital expenditures ................................................... (174,641) (155,196) (148,986)
Increase in investments and other assets ................................ (13,842) (9,728) (20,428)
Proceeds from disposition of assets .................................... 9,043 10,564 22,673
Collection of note receivable ........................................... - 10,660 2,989
Net cash used in investing activities .................................. (417,050) (477,212) (296,616)
Cash flows from financing activities:
Proceeds from borrowings ............................................. 450,000 475,237 969,939
Repayments of debt ................................................... (391,718) (634,278) (1,175,489)
Purchases of treasury stock ............................................ (257,548) - -
Exercise of stock options .............................................. 29,887 27,034 25,631
Distributions to minority partners ...................................... (14,253) (12,192) (8,718)
Financing costs paid .................................................. (4,227) (129) (28,459)
Redemption of preferred stock ......................................... - - (1,000)
Preferred dividends paid ............................................... - - (236)
Other ................................................................ 291 (386) -
Net cash used in financing activities.................................. (187,568) (144,714) (218,332)
Net change in cash and cash equivalents ............................. 58,181 (25,555) (49,145)
Cash and cash equivalents, beginning of year ........................ 96,777 122,332 171,477
Cash and cash equivalents, end of year .............................. $ 154,958 $ 96,777 $ 122,332
The accompanying notes are an integral part of these statements.
F-4