Quest Diagnostics 2000 Annual Report Download - page 86
Download and view the complete annual report
Please find page 86 of the 2000 Quest Diagnostics annual report below. You can navigate through the pages in the report by either clicking on the pages listed below, or by using the keyword search tool below to find specific information within the annual report.-
 1
1 -
2
-
3
-
4
-
5
-
6
-
7
-
8
-
9
-
10
-
11
-
12
-
13
-
14
-
15
-
16
-
17
-
18
-
19
-
20
-
21
-
22
-
23
-
24
-
25
-
26
-
27
-
28
-
29
-
30
-
31
-
32
-
33
-
34
-
35
-
36
-
37
-
38
-
39
-
40
-
41
-
42
-
43
-
44
-
45
-
46
-
47
-
48
-
49
-
50
-
51
-
52
-
53
-
54
-
55
-
56
-
57
-
58
-
59
-
60
-
61
-
62
-
63
-
64
-
65
-
66
-
67
-
68
-
69
-
70
-
71
-
72
-
73
-
74
-
75
-
 76
76 -
 77
77 -
 78
78 -
 79
79 -
 80
80 -
 81
81 -
 82
82 -
 83
83 -
 84
84 -
 85
85 -
 86
86 -
 87
87 -
 88
88 -
 89
89 -
 90
90 -
 91
91 -
 92
92 -
 93
93 -
 94
94 -
 95
95 -
 96
96 -
97
-
98
-
99
-
100
-
101
-
102
-
103
-
104
-
105
-
106
-
107
-
108
 |
 |

QUEST DIAGNOSTICS INCORPORATED AND SUBSIDIARIES
NOTES TO CONSOLIDATED FINANCIAL STATEMENTS (Continued)
(dollars in thousands unless otherwise indicated)
F-16
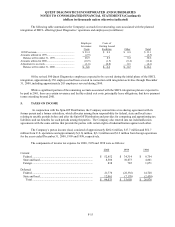
A reconciliation of the federal statutory rate to the Company's effective tax rate for 2000, 1999 and 1998 was as
follows:
2000 1999 1998
Tax provision (benefit) at statutory rate......................................... 35.0% 35.0% 35.0%
State and local income taxes, net of federal benefit 5.6 4.3 3.4
Non-deductible goodwill amortization .......................................... 6.7 55.7 9.3
Impact of foreign operations .......................................................... 0.4 11.6 1.2
Non-deductible meals and entertainment expense ........................ 0.7 5.1 1.2
Other, net ........................................................................................ (0.6) (2.8) -
Effective tax rate ..................................................................... 47.8% 108.9% 50.1%
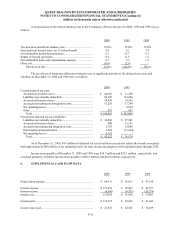
The tax effects of temporary differences that give rise to significant portions of the deferred tax assets and
liabilities at December 31, 2000 and 1999 were as follows:
2000 1999
Current deferred tax asset:
Accounts receivable reserve....................................................... $ 46,266 $ 11,459
Liabilities not currently deductible............................................. 94,107 134,206
Accrued settlement reserves ....................................................... 34,430 19,542
Accrued restructuring and integration costs............................... 13,205 17,784
Net operating losses.................................................................... - 8,830
Other............................................................................................ 475 987
Total ........................................................................................ $ 188,483 $ 192,808
Non-current deferred tax asset (liability):
Liabilities not currently deductible............................................. $ 34,062 $ 27,581
Accrued settlement reserves ....................................................... 600 13,351
Accrued restructuring and integration costs............................... 2,763 12,886
Depreciation and amortization ................................................... 1,062 (17,644)
Net operating losses.................................................................... 4,135 -
Total ........................................................................................ $ 42,622 $ 36,174
As of December 31, 2000, $4.1 million of deferred tax assets had been recorded to reflect the benefit associated
with approximately $86 million of net operating losses for state income tax purposes with expiration dates through 2020.
Income taxes payable at December 31, 2000 and 1999 were $18.5 million and $29.3 million, respectively, and
consisted primarily of federal income taxes payable of $20.6 million and $24.9 million, respectively.
6. SUPPLEMENTAL CASH FLOW DATA
2000 1999 1998
Depreciation expense ..................................................................... $ 88,631 $ 61,051 $ 47,148
Interest expense .............................................................................. $ 119,681 $ 69,842 $ 43,977
Interest income ............................................................................... (6,589) (8,392) (10,574)
Interest, net ..................................................................................... 113,092 $ 61,450 $ 33,403
Interest paid .................................................................................... $ 110,227 $ 62,662 $ 41,243
Income taxes paid........................................................................... $ 21,821 $ 24,545 $ 16,269