Quest Diagnostics 2000 Annual Report Download - page 102
Download and view the complete annual report
Please find page 102 of the 2000 Quest Diagnostics annual report below. You can navigate through the pages in the report by either clicking on the pages listed below, or by using the keyword search tool below to find specific information within the annual report.-
 1
1 -
2
-
3
-
4
-
5
-
6
-
7
-
8
-
9
-
10
-
11
-
12
-
13
-
14
-
15
-
16
-
17
-
18
-
19
-
20
-
21
-
22
-
23
-
24
-
25
-
26
-
27
-
28
-
29
-
30
-
31
-
32
-
33
-
34
-
35
-
36
-
37
-
38
-
39
-
40
-
41
-
42
-
43
-
44
-
45
-
46
-
47
-
48
-
49
-
50
-
51
-
52
-
53
-
54
-
55
-
56
-
57
-
58
-
59
-
60
-
61
-
62
-
63
-
64
-
65
-
66
-
67
-
68
-
69
-
70
-
71
-
72
-
73
-
74
-
75
-
76
-
77
-
78
-
79
-
80
-
81
-
82
-
83
-
84
-
85
-
86
-
87
-
88
-
89
-
90
-
91
-
 92
92 -
 93
93 -
 94
94 -
 95
95 -
 96
96 -
 97
97 -
 98
98 -
 99
99 -
 100
100 -
 101
101 -
 102
102 -
 103
103 -
 104
104 -
 105
105 -
 106
106 -
 107
107 -
 108
108
 |
 |

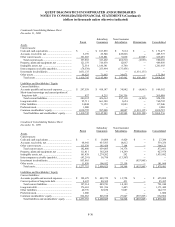
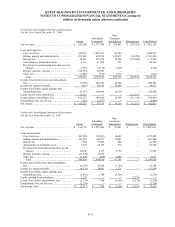
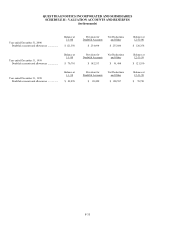
QUEST DIAGNOSTICS INCORPORATED AND SUBSIDIARIES
NOTES TO CONSOLIDATED FINANCIAL STATEMENTS (Continued)
(dollars in thousands unless otherwise indicated)
F-32
Condensed Consolidating Statement of Operations
For the Year Ended December 31, 1998
Parent
Subsidiary
Guarantors
Non-
Guarantor
Subsidiaries Eliminations Consolidated
Net revenues............................................................ $ 594,544 $ 828,119 $ 35,944 $ -- $ 1,458,607
Costs and expenses:
Cost of services ................................................... 365,065 510,945 20,783 -- 896,793
Selling, general and administrative..................... 239,329 196,984 9,572 -- 445,885
Interest, net 8,608 24,190 605 -- 33,403
Amortization of intangible assets ....................... 7,538 13,766 393 -- 21,697
Royalty (income) expense .................................. (73,138) 73,138 -- -- --
Other, net............................................................. (219) 6 7,181 -- 6,968
Total ................................................................ 547,183 819,029 38,534 -- 1,404,746
Income (loss) before taxes ...................................... 47,361 9,090 (2,590) -- 53,861
Income tax expense (benefit).................................. 18,961 9,248 (1,233) -- 26,976
Equity loss from subsidiaries.................................. (1,515) -- -- 1,515 --
Net income (loss) .................................................... $ 26,885 $ (158) $ (1,357) $ 1,515 $ 26,885
Condensed Consolidating Statement of Cash Flows
For the Year Ended December 31, 2000
Parent
Subsidiary
Guarantors
Non-
Guarantor
Subsidiaries Eliminations Consolidated
Cash flows from operating activities:
Net income .............................................................. $ 102,052 $ 97,376 $ 14,136 $ (111,512) $ 102,052
Extraordinary loss, net of taxes............................... 223 2,673 -- -- 2,896
Adjustments to reconcile net income to net cash
provided by (used in) operating activities:
Depreciation and amortization............................ 30,447 99,234 4,615 -- 134,296
Provision for doubtful accounts.......................... 14,333 117,927 102,434 -- 234,694
Provisions for restructuring and other special
charges............................................................. 2,594 (4,134) 3,640 -- 2,100
Other, net............................................................. (96,318) 140,905 15,850 3,273 63,710
Changes in operating assets and liabilities ......... 73,941 (168,296) (184,177) 108,239 (170,293)
Net cash provided by (used in) operating
activities............................................................... 127,272 285,685 (43,502) -- 369,455
Net cash provided by (used in) investing
activities............................................................... 89,886 (66,325) (4,948) (66,628) (48,015)
Net cash provided by (used in) financing
activities............................................................... (217,158) (74,361) 47,644 66,628 (177,247)
Net change in cash and cash equivalents................ -- 144,999 (806) -- 144,193
Cash and cash equivalents, beginning of year........ -- 18,864 8,420 -- 27,284
Cash and cash equivalents, end of year .................. $ -- $ 163,863 $ 7,614 $ -- $ 171,477