Quest Diagnostics 2000 Annual Report Download - page 73
Download and view the complete annual report
Please find page 73 of the 2000 Quest Diagnostics annual report below. You can navigate through the pages in the report by either clicking on the pages listed below, or by using the keyword search tool below to find specific information within the annual report.-
 1
1 -
2
-
3
-
4
-
5
-
6
-
7
-
8
-
9
-
10
-
11
-
12
-
13
-
14
-
15
-
16
-
17
-
18
-
19
-
20
-
21
-
22
-
23
-
24
-
25
-
26
-
27
-
28
-
29
-
30
-
31
-
32
-
33
-
34
-
35
-
36
-
37
-
38
-
39
-
40
-
41
-
42
-
43
-
44
-
45
-
46
-
47
-
48
-
49
-
50
-
51
-
52
-
53
-
54
-
55
-
56
-
57
-
58
-
59
-
60
-
61
-
62
-
 63
63 -
 64
64 -
 65
65 -
 66
66 -
 67
67 -
 68
68 -
 69
69 -
 70
70 -
 71
71 -
 72
72 -
 73
73 -
 74
74 -
 75
75 -
 76
76 -
 77
77 -
 78
78 -
 79
79 -
 80
80 -
 81
81 -
 82
82 -
 83
83 -
84
-
85
-
86
-
87
-
88
-
89
-
90
-
91
-
92
-
93
-
94
-
95
-
96
-
97
-
98
-
99
-
100
-
101
-
102
-
103
-
104
-
105
-
106
-
107
-
108
 |
 |

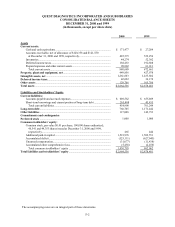
F-3
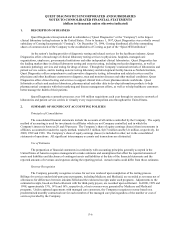
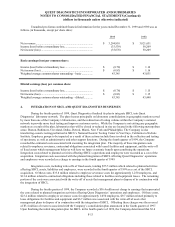
QUEST DIAGNOSTICS INCORPORATED AND SUBSIDIARIES
CONSOLIDATED STATEMENTS OF OPERATIONS
FOR THE YEARS ENDED DECEMBER 31, 2000, 1999 AND 1998
(in thousands, except per share data)
2000 1999 1998
Net revenues ....................................................................... $3,421,162 $2,205,243 $1,458,607
Costs and expenses:
Cost of services ................................................................ 2,056,237 1,379,989 896,793
Selling, general and administrative .................................. 1,001,443 643,440 445,885
Interest, net....................................................................... 113,092 61,450 33,403
Amortization of intangible assets ..................................... 45,665 29,784 21,697
Provisions for restructuring and other special charges..... 2,100 73,385 -
Minority share of income ................................................. 9,359 5,431 2,017
Other, net.......................................................................... (7,715) (2,620) 4,951
Total.............................................................................. 3,220,181 2,190,859 1,404,746
Income before taxes and extraordinary loss…................ 200,981 14,384 53,861
Income tax expense............................................................ 15,658 26,976
Income (loss) before extraordinary loss...........................
96,033
104,948 (1,274) 26,885
Extraordinary loss, net of taxes........................................ (2,896) (2,139) -
Net income (loss) ................................................................ $ 102,052 $ (3,413) $ 26,885
Basic net income (loss) per common share:
Income (loss) before extraordinary loss............................... $ 2.34 $ (0.04) $ 0.90
Extraordinary loss, net of taxes............................................ (0.06) (0.06) -
Net income (loss)................................................................. $ 2.28 $ (0.10) $ 0.90
Diluted net income (loss) per common share:
Income (loss) before extraordinary loss............................... $ 2.22 $ (0.04) $ 0.89
Extraordinary loss, net of taxes............................................ (0.06) (0.06) -
Net income (loss)................................................................. $ 2.16 $ (0.10) $ 0.89
The accompanying notes are an integral part of these statements.