Quest Diagnostics 2000 Annual Report Download - page 74
Download and view the complete annual report
Please find page 74 of the 2000 Quest Diagnostics annual report below. You can navigate through the pages in the report by either clicking on the pages listed below, or by using the keyword search tool below to find specific information within the annual report.-
 1
1 -
2
-
3
-
4
-
5
-
6
-
7
-
8
-
9
-
10
-
11
-
12
-
13
-
14
-
15
-
16
-
17
-
18
-
19
-
20
-
21
-
22
-
23
-
24
-
25
-
26
-
27
-
28
-
29
-
30
-
31
-
32
-
33
-
34
-
35
-
36
-
37
-
38
-
39
-
40
-
41
-
42
-
43
-
44
-
45
-
46
-
47
-
48
-
49
-
50
-
51
-
52
-
53
-
54
-
55
-
56
-
57
-
58
-
59
-
60
-
61
-
62
-
63
-
 64
64 -
 65
65 -
 66
66 -
 67
67 -
 68
68 -
 69
69 -
 70
70 -
 71
71 -
 72
72 -
 73
73 -
 74
74 -
 75
75 -
 76
76 -
 77
77 -
 78
78 -
 79
79 -
 80
80 -
 81
81 -
 82
82 -
 83
83 -
 84
84 -
85
-
86
-
87
-
88
-
89
-
90
-
91
-
92
-
93
-
94
-
95
-
96
-
97
-
98
-
99
-
100
-
101
-
102
-
103
-
104
-
105
-
106
-
107
-
108
 |
 |

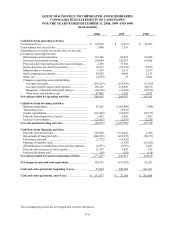
F-4
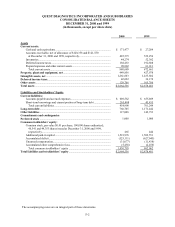
QUEST DIAGNOSTICS INCORPORATED AND SUBSIDIARIES
CONSOLIDATED STATEMENTS OF CASH FLOWS
FOR THE YEARS ENDED DECEMBER 31, 2000, 1999 AND 1998
(in thousands)
2000 1999 1998
Cash flows from operating activities:
Net income (loss).................................................................... $ 102,052 $ (3,413) $ 26,885
Extraordinary loss, net of taxes.............................................. 2,896 2,139 -
Adjustments to reconcile net income (loss) to net cash
provided by operating activities:
Depreciation and amortization ........................................... 134,296 90,835 68,845
Provision for doubtful accounts ......................................... 234,694 142,333 89,428
Provisions for restructuring and other special charges ...... 2,100 73,385 -
Deferred income tax (benefit) provision............................ 33,837 (29,514) 12,290
Minority share of income ................................................... 9,359 5,431 2,017
Stock compensation expense.............................................. 24,592 6,068 2,113
Other, net............................................................................. (4,078) 37 6,902
Changes in operating assets and liabilities:
Accounts receivable........................................................ (250,255) (118,693) (71,920)
Accounts payable and accrued expenses........................ 100,223 110,929 40,070
Integration, settlement and special charges.................... (68,150) (33,326) (39,518)
Other assets and liabilities, net ....................................... 47,889 3,324 4,270
Net cash provided by operating activities.......................... 369,455 249,535 141,382
Cash flows from investing activities:
Business acquisitions.......................................................... 92,225 (1,025,000) (948)
Transaction costs ................................................................ - (9,612) -
Capital expenditures ........................................................... (116,450) (76,029) (39,575)
Proceeds from disposition of assets ................................... 3,625 4,982 3,035
Increase in investments....................................................... (27,415) (2,331) (2,232)
Net cash used in investing activities ................................... (48,015) (1,107,990) (39,720)
Cash flows from financing activities:
Proceeds from borrowings.................................................. 256,000 1,132,843 4,300
Repayments of long-term debt ........................................... (446,762) (412,035) (54,153)
Financing costs paid ........................................................... (1,732) (36,822) -
Purchase of treasury stock .................................................. - (1,103) (13,032)
(Distributions to) contributions from minority partners .... (6,871) (4,363) 2,443
Proceeds from exercise of stock options............................ 22,147 4,429 145
Preferred dividends paid..................................................... (29) (118) (118)
Net cash provided by (used in) financing activities .......... (177,247) 682,831 (60,415)
Net change in cash and cash equivalents ........................... 144,193 (175,624) 41,247
Cash and cash equivalents, beginning of year .................. 27,284 202,908 161,661
Cash and cash equivalents, end of year ............................. $ 171,477 $ 27,284 $ 202,908
The accompanying notes are an integral part of these statements.