Quest Diagnostics 2000 Annual Report Download - page 77
Download and view the complete annual report
Please find page 77 of the 2000 Quest Diagnostics annual report below. You can navigate through the pages in the report by either clicking on the pages listed below, or by using the keyword search tool below to find specific information within the annual report.-
 1
1 -
2
-
3
-
4
-
5
-
6
-
7
-
8
-
9
-
10
-
11
-
12
-
13
-
14
-
15
-
16
-
17
-
18
-
19
-
20
-
21
-
22
-
23
-
24
-
25
-
26
-
27
-
28
-
29
-
30
-
31
-
32
-
33
-
34
-
35
-
36
-
37
-
38
-
39
-
40
-
41
-
42
-
43
-
44
-
45
-
46
-
47
-
48
-
49
-
50
-
51
-
52
-
53
-
54
-
55
-
56
-
57
-
58
-
59
-
60
-
61
-
62
-
63
-
64
-
65
-
66
-
 67
67 -
 68
68 -
 69
69 -
 70
70 -
 71
71 -
 72
72 -
 73
73 -
 74
74 -
 75
75 -
 76
76 -
 77
77 -
 78
78 -
 79
79 -
 80
80 -
 81
81 -
 82
82 -
 83
83 -
 84
84 -
 85
85 -
 86
86 -
 87
87 -
88
-
89
-
90
-
91
-
92
-
93
-
94
-
95
-
96
-
97
-
98
-
99
-
100
-
101
-
102
-
103
-
104
-
105
-
106
-
107
-
108
 |
 |

QUEST DIAGNOSTICS INCORPORATED AND SUBSIDIARIES
NOTES TO CONSOLIDATED FINANCIAL STATEMENTS (Continued)
(dollars in thousands unless otherwise indicated)
F-7
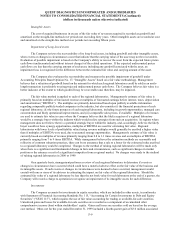
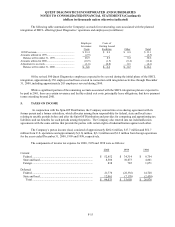
Taxes on Income
The Company uses the asset and liability approach to account for income taxes. Under this method, deferred tax
assets and liabilities are recognized for the expected future tax consequences of differences between the carrying amounts
of assets and liabilities and their respective tax bases using tax rates in effect for the year in which the differences are
expected to reverse. The effect on deferred tax assets and liabilities of a change in tax rates is recognized in income in
the period when the change is enacted.
Earnings Per Share
Basic net income (loss) per common share is calculated by dividing net income (loss), less preferred stock
dividends, by the weighted average number of common shares outstanding. Diluted net income (loss) per common share
is calculated by dividing net income (loss), less preferred stock dividends, by the weighted average number of common
shares outstanding after giving effect to all potentially dilutive common shares outstanding during the period. Potentially
dilutive common shares include outstanding stock options and restricted common shares granted under the Company’s
Employee Equity Participation Program. During periods in which net income available for common stockholders is a
loss, diluted weighted average common shares outstanding will equal basic weighted average common shares
outstanding, since under these circumstances, the incremental shares would have an anti-dilutive effect.
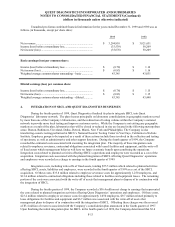
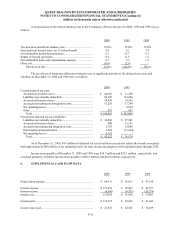
The computation of basic and diluted net income (loss) per common share was as follows (in thousands except
per share data):
2000 1999 1998
Income (loss) before extraordinary loss..................................... $ 104,948 $ (1,274) $ 26,885
Less: Preferred stock dividends ................................................. 118 118 118
Income (loss) available to common stockholders – basic and
diluted .................................................................................... $ 104,830 $ (1,392) $ 26,767
Weighted average number of common shares outstanding –
basic ....................................................................................... 44,763 35,014 29,684
Effect of dilutive securities:
Stock options ............................................................................. 2,095 - 401
Restricted common stock........................................................... 292 - 144
Weighted average number of common shares outstanding –
diluted .................................................................................... 47,150 35,014 30,229
Basic net income (loss) per common share:
Income (loss) before extraordinary loss..................................... $ 2.34 $ (0.04) $ 0.90
Diluted net income (loss) per common share:
Income (loss) before extraordinary loss..................................... $ 2.22 $ (0.04) $ 0.89
The following securities were not included in the diluted net income (loss) per share calculation due to their
antidilutive effect (in thousands):
2000 1999 1998
Stock options .................................................................................. 63 5,741 107
Restricted common stock ............................................................... 11 568 -