Quest Diagnostics 2000 Annual Report Download - page 50
Download and view the complete annual report
Please find page 50 of the 2000 Quest Diagnostics annual report below. You can navigate through the pages in the report by either clicking on the pages listed below, or by using the keyword search tool below to find specific information within the annual report.-
 1
1 -
2
-
3
-
4
-
5
-
6
-
7
-
8
-
9
-
10
-
11
-
12
-
13
-
14
-
15
-
16
-
17
-
18
-
19
-
20
-
21
-
22
-
23
-
24
-
25
-
26
-
27
-
28
-
29
-
30
-
31
-
32
-
33
-
34
-
35
-
36
-
37
-
38
-
39
-
 40
40 -
 41
41 -
 42
42 -
 43
43 -
 44
44 -
 45
45 -
 46
46 -
 47
47 -
 48
48 -
 49
49 -
 50
50 -
 51
51 -
 52
52 -
 53
53 -
 54
54 -
 55
55 -
 56
56 -
 57
57 -
 58
58 -
 59
59 -
 60
60 -
61
-
62
-
63
-
64
-
65
-
66
-
67
-
68
-
69
-
70
-
71
-
72
-
73
-
74
-
75
-
76
-
77
-
78
-
79
-
80
-
81
-
82
-
83
-
84
-
85
-
86
-
87
-
88
-
89
-
90
-
91
-
92
-
93
-
94
-
95
-
96
-
97
-
98
-
99
-
100
-
101
-
102
-
103
-
104
-
105
-
106
-
107
-
108
 |
 |

30
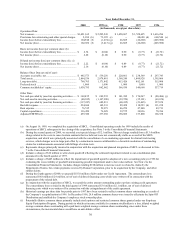
Year Ended December 31,
2000 1999 (a) 1998 1997 1996
(in thousands, except per share data)
Operations Data:
Net revenues................................................................. $3,421,162 $ 2,205,243 $ 1,458,607 $ 1,528,695 $ 1,616,296
Provisions for restructuring and other special charges 2,100 (b) 73,385 (c) -- 48,688 (d) 668,544 (e)
Income (loss) before extraordinary loss ....................... 104,948 (f) (1,274) (g) 26,885 (22,260) (625,960)
Net income (loss) ......................................................... 102,052 (f) (3,413) (g) 26,885 (22,260) (625,960)
Basic net income (loss) per common share: (h)
Income (loss) before extraordinary loss ....................... $ 2.34 $ (0.04) $ 0.90 $ (0.77) $ (21.72)
Net income (loss) ......................................................... 2.28 (0.10) 0.90 (0.77) (21.72)
Diluted net income (loss) per common share: (h), (i)
Income (loss) before extraordinary loss ....................... $ 2.22 $ (0.04) $ 0.89 $ (0.77) $ (21.72)
Net income (loss) ......................................................... 2.16 (0.10) 0.89 (0.77) (21.72)
Balance Sheet Data (at end of year):
Accounts receivable, net .............................................. $ 485,573 $ 539,256 $ 220,861 $ 238,369 $ 297,743
Total assets................................................................... 2,864,536 2,878,481 1,360,240 1,400,928 1,395,066
Long-term debt............................................................. 760,705 1,171,442 413,426 482,161 515,008
Preferred stock ............................................................ 1,000 1,000 1,000 1,000 1,000
Common stockholders’ equity...................................... 1,030,795 862,062 566,930 540,660 537,719
Other Data:
Net cash provided by (used in) operating activities...... $ 369,455 $ 249,535 $ 141,382 $ 176,267 $ (88,486) (j)
Net cash used in investing activities............................. (48,015) (1,107,990) (39,720) (35,101) (63,674)
Net cash provided by (used in) financing activities...... (117,247) 682,831 (60,415) (21,465) 157,674
Bad debt expense ......................................................... 234,694 142,333 89,428 118,223 (k) 111,238
Rent expense ................................................................ 76,515 59,073 46,259 47,940 49,713
Capital expenditures..................................................... 116,450 76,029 39,575 30,836 70,396
Adjusted EBITDA (l)................................................... 459,380 237,038 158,609 153,800 166,358
(a) On August 16, 1999, we completed the acquisition of SBCL. Consolidated operating results for 1999 include the results of
operations of SBCL subsequent to the closing of the acquisition. See Note 3 to the Consolidated Financial Statements.
(b) During the second quarter of 2000, we recorded a net special charge of $2.1 million. This net charge resulted from a $13.4 million
charge related to the costs to cancel certain contracts that we believed were not economically viable as a result of the SBCL
acquisition, and which were principally associated with the cancellation of a co-marketing agreement for clinical trials testing
services, which charges were in large part offset by a reduction in reserves attributable to a favorable resolution of outstanding
claims for reimbursements associated with billings of certain tests.
(c) Represents charges principally incurred in conjunction with the acquisition and planned integration of SBCL as discussed in Note
7 to the Consolidated Financial Statements.
(d) Includes a charge of $16 million to write-down goodwill reflecting the estimated impairment related to our consolidation plan
announced in the fourth quarter of 1997.
(e) Includes a charge of $445 million to reflect the impairment of goodwill upon the adoption of a new accounting policy in 1996 for
evaluating the recoverability of goodwill and measuring possible impairment under a fair value method. See Note 2 to the
Consolidated Financial Statements. Includes charges totaling $188 million to increase reserves related to claims by the
Department of Justice for certain payments received by Damon Corporation, prior to its acquisition by the Company, and other
similar claims.
(f) During the fourth quarter of 2000, we prepaid $155.0 million of debt under our Credit Agreement. The extraordinary loss
represented $4.8 million ($2.9 million, net of tax) of deferred financing costs which were written-off in connection with the
prepayment of the related debt.
(g) In conjunction with the acquisition of SBCL, we repaid the entire amount outstanding under our then existing credit agreement.
The extraordinary loss recorded in the third quarter of 1999 represented $3.6 million ($2.1 million, net of tax) of deferred
financing costs which were written-off in connection with the extinguishment of the credit agreement.
(h) Historical earnings per share data for periods prior to 1997 have been restated to reflect common shares outstanding as a result of
the Company’s recapitalization in 1996. In December 1996, 28.8 million common shares were issued to effectuate the Spin-Off
Distribution and establish the Company’s employee stock ownership plan.
(i) Potentially dilutive common shares primarily include stock options and restricted common shares granted under our Employee
Equity Participation Program. During periods in which net income available for common stockholders is a loss, diluted weighted
average common shares outstanding will equal basic weighted average common shares outstanding, since under these
circumstances, the incremental shares would have an anti-dilutive effect.