Quest Diagnostics 2000 Annual Report Download - page 83
Download and view the complete annual report
Please find page 83 of the 2000 Quest Diagnostics annual report below. You can navigate through the pages in the report by either clicking on the pages listed below, or by using the keyword search tool below to find specific information within the annual report.-
 1
1 -
2
-
3
-
4
-
5
-
6
-
7
-
8
-
9
-
10
-
11
-
12
-
13
-
14
-
15
-
16
-
17
-
18
-
19
-
20
-
21
-
22
-
23
-
24
-
25
-
26
-
27
-
28
-
29
-
30
-
31
-
32
-
33
-
34
-
35
-
36
-
37
-
38
-
39
-
40
-
41
-
42
-
43
-
44
-
45
-
46
-
47
-
48
-
49
-
50
-
51
-
52
-
53
-
54
-
55
-
56
-
57
-
58
-
59
-
60
-
61
-
62
-
63
-
64
-
65
-
66
-
67
-
68
-
69
-
70
-
71
-
72
-
 73
73 -
 74
74 -
 75
75 -
 76
76 -
 77
77 -
 78
78 -
 79
79 -
 80
80 -
 81
81 -
 82
82 -
 83
83 -
 84
84 -
 85
85 -
 86
86 -
 87
87 -
 88
88 -
 89
89 -
 90
90 -
 91
91 -
 92
92 -
 93
93 -
94
-
95
-
96
-
97
-
98
-
99
-
100
-
101
-
102
-
103
-
104
-
105
-
106
-
107
-
108
 |
 |

QUEST DIAGNOSTICS INCORPORATED AND SUBSIDIARIES
NOTES TO CONSOLIDATED FINANCIAL STATEMENTS (Continued)
(dollars in thousands unless otherwise indicated)
F-13
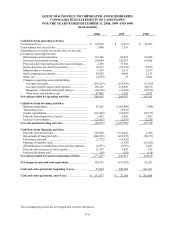
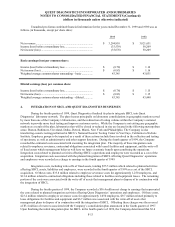
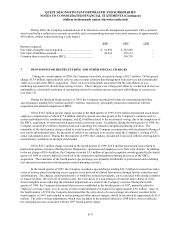
Unaudited pro forma combined financial information for the years ended December 31, 1999 and 1998 was as
follows (in thousands, except per share data):
1999 1998
Net revenues ................................................................................... $ 3,294,810 $ 3,021,631
Income (loss) before extraordinary loss......................................... (33,539) 50,209
Net income (loss)............................................................................ (35,678) 50,209
Basic earnings (loss) per common share:
Income (loss) before extraordinary loss......................................... $ (0.78) $ 1.16
Net income (loss)............................................................................ $ (0.83) $ 1.16
Weighted average common shares outstanding – basic ................ 43,345 43,031
Diluted earnings (loss) per common share:
Income (loss) before extraordinary loss......................................... $ (0.78) $ 1.15
Net income (loss)............................................................................ $ (0.83) $ 1.15
Weighted average common shares outstanding – diluted ............. 43,345 43,440
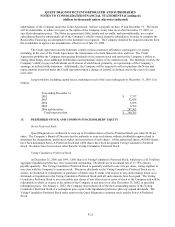
4. INTEGRATION OF SBCL AND QUEST DIAGNOSTICS BUSINESSES
During the fourth quarter of 1999, Quest Diagnostics finalized its plan to integrate SBCL into Quest
Diagnostics’ laboratory network. The plan focuses principally on laboratory consolidations in geographic markets served
by more than one of the Company’s laboratories, and the redirection of testing volume within the Company’s national
network to provide more local testing and improve customer service. While the Company is not exiting any geographic
markets as a result of the plan, laboratories that will be closed or reduced in size are located in the following metropolitan
areas: Boston, Baltimore, Cleveland, Dallas, Detroit, Miami, New York and Philadelphia. The Company is also
transferring esoteric testing performed at SBCL’s National Esoteric Testing Center in Van Nuys, California to Nichols
Institute. Employee groups to be impacted as a result of these actions include those involved in the collection and testing
of specimens, as well as administrative and other support functions. During the fourth quarter of 1999, the Company
recorded the estimated costs associated with executing the integration plan. The majority of these integration costs
related to employee severance, contractual obligations associated with leased facilities and equipment, and the write-off
of fixed assets which management believes will have no future economic benefit upon combining the operations.
Integration costs related to planned activities affecting SBCL’s operations and employees were recorded as a cost of the
acquisition. Integration costs associated with the planned integration of SBCL affecting Quest Diagnostics’ operations
and employees were recorded as a charge to earnings in the fourth quarter of 1999.
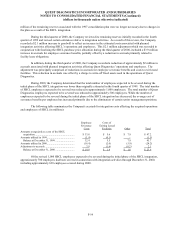
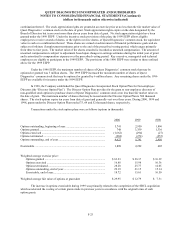
Integration costs, including write-offs of fixed assets, totaling $55.5 million which related to planned activities
affecting SBCL assets, liabilities and employees, were recorded in the fourth quarter of 1999 as a cost of the SBCL
acquisition. Of these costs, $33.8 million related to employee severance costs for approximately 1,250 employees, and
$13.4 million related to contractual obligations including those related to facilities and equipment leases. The remaining
portion of the costs were associated with the write-off of assets that management plans to dispose of in conjunction with
the integration of SBCL.
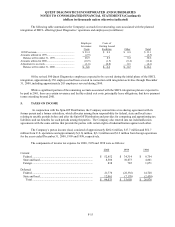
During the fourth quarter of 1999, the Company recorded a $36.4 million net charge to earnings that represented
the costs related to planned integration activities affecting Quest Diagnostics’ operations and employees. Of these costs,
$23.4 million related to employee severance costs for approximately 1,050 employees, $9.7 million related primarily to
lease obligations for facilities and equipment and $6.7 million was associated with the write-off of assets that
management plans to dispose of in conjunction with the integration of SBCL. Offsetting these charges was the reversal
of $3.4 million of reserves associated with the Company’s consolidation plan announced in the fourth quarter of 1997.
Upon finalizing the initial integration plan for SBCL in the fourth quarter of 1999, the Company determined that $3.4