Quest Diagnostics 2000 Annual Report Download - page 101
Download and view the complete annual report
Please find page 101 of the 2000 Quest Diagnostics annual report below. You can navigate through the pages in the report by either clicking on the pages listed below, or by using the keyword search tool below to find specific information within the annual report.-
 1
1 -
2
-
3
-
4
-
5
-
6
-
7
-
8
-
9
-
10
-
11
-
12
-
13
-
14
-
15
-
16
-
17
-
18
-
19
-
20
-
21
-
22
-
23
-
24
-
25
-
26
-
27
-
28
-
29
-
30
-
31
-
32
-
33
-
34
-
35
-
36
-
37
-
38
-
39
-
40
-
41
-
42
-
43
-
44
-
45
-
46
-
47
-
48
-
49
-
50
-
51
-
52
-
53
-
54
-
55
-
56
-
57
-
58
-
59
-
60
-
61
-
62
-
63
-
64
-
65
-
66
-
67
-
68
-
69
-
70
-
71
-
72
-
73
-
74
-
75
-
76
-
77
-
78
-
79
-
80
-
81
-
82
-
83
-
84
-
85
-
86
-
87
-
88
-
89
-
90
-
 91
91 -
 92
92 -
 93
93 -
 94
94 -
 95
95 -
 96
96 -
 97
97 -
 98
98 -
 99
99 -
 100
100 -
 101
101 -
 102
102 -
 103
103 -
 104
104 -
 105
105 -
 106
106 -
 107
107 -
 108
108
 |
 |

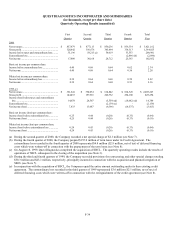
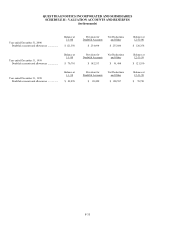
QUEST DIAGNOSTICS INCORPORATED AND SUBSIDIARIES
NOTES TO CONSOLIDATED FINANCIAL STATEMENTS (Continued)
(dollars in thousands unless otherwise indicated)
F-31
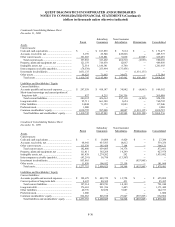
Condensed Consolidating Statement of Operations
For the Year Ended December 31, 2000
Parent
Subsidiary
Guarantors
Non-
Guarantor
Subsidiaries Eliminations Consolidated
Net revenues ........................................................ $ 520,198 $ 2,773,568 $ 274,987 $ (147,591) $ 3,421,162
Costs and expenses:
Cost of services ................................................ 348,227 1,621,667 86,343 -- 2,056,237
Selling, general and administrative .................. 233,409 638,534 139,993 (10,493) 1,001,443
Interest, net....................................................... 38,436 195,614 16,140 (137,098) 113,092
Amortization of intangible assets..................... 4,153 41,005 507 -- 45,665
Provisions for restructuring and other special
charges ......................................................... 2,594 (4,134) 3,640 -- 2,100
Royalty (income) expense................................ (94,959) 94,959 -- -- --
Other, net ......................................................... (1,806) (322) 3,772 -- 1,644
Total ............................................................. 530,054 2,587,323 250,395 (147,591) 3,220,181
Income (loss) before taxes and extraordinary
loss................................................................... (9,856) 186,245 24,592 -- 200,981
Income tax expense (benefit) ............................... (619) 86,196 10,456 -- 96,033
Income (loss) before equity earnings and
extraordinary loss................................................ (9,237) 100,049 14,136 - 104,948
Equity income from subsidiaries.......................... 111,512 -- -- (111,512) --
Income before extraordinary loss............................ 102,275 100,049 14,136 (111,512) 104,948
Extraordinary loss, net of taxes............................... (223) (2,673) -- -- (2,896)
Net income .......................................................... $ 102,052 $ 97,376 $ 14,136 $ (111,512) $ 102,052
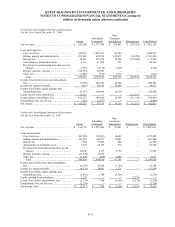
Condensed Consolidating Statement of Operations
For the Year Ended December 31, 1999
Parent
Subsidiary
Guarantors
Non-
Guarantor
Subsidiaries Eliminations Consolidated
Net revenues ........................................................ $ 636,778 $ 1,475,064 $ 93,401 $ -- $ 2,205,243
Costs and expenses:
Cost of services ................................................... 407,908 915,438 56,643 -- 1,379,989
Selling, general and administrative..................... 232,558 380,237 30,645 -- 643,440
Interest, net 9,508 51,456 486 -- 61,450
Amortization of intangible assets ....................... 7,307 22,103 374 -- 29,784
Provisions for restructuring and other special
charges............................................................. 62,496 8,137 2,752 -- 73,385
Royalty (income) expense .................................. (71,678) 71,678 -- -- --
Other, net............................................................. (3,245) (230) 6,286 -- 2,811
Total ................................................................ 644,854 1,448,819 97,186 -- 2,190,859
Income (loss) before taxes and extraordinary
loss....................................................................... (8,076) 26,245 (3,785) -- 14,384
Income tax expense(benefit)................................... (4,524) 18,461 1,721 -- 15,658
Income (loss) before equity earnings and
extraordinary loss................................................ (3,552) 7,784 (5,506) -- (1,274)
Equity earnings from subsidiaries........................... 2,278 -- -- (2,278) --
Income (loss) before extraordinary loss.................. (1,274) 7,784 (5,506) (2,278) (1,274)
Extraordinary loss, net of taxes............................... (2,139) -- -- -- (2,139)
Net income (loss) ................................................... $ (3,413) $ 7,784 $ (5,506) $ (2,278) $ (3,413)