Quest Diagnostics 2000 Annual Report Download - page 100
Download and view the complete annual report
Please find page 100 of the 2000 Quest Diagnostics annual report below. You can navigate through the pages in the report by either clicking on the pages listed below, or by using the keyword search tool below to find specific information within the annual report.-
 1
1 -
2
-
3
-
4
-
5
-
6
-
7
-
8
-
9
-
10
-
11
-
12
-
13
-
14
-
15
-
16
-
17
-
18
-
19
-
20
-
21
-
22
-
23
-
24
-
25
-
26
-
27
-
28
-
29
-
30
-
31
-
32
-
33
-
34
-
35
-
36
-
37
-
38
-
39
-
40
-
41
-
42
-
43
-
44
-
45
-
46
-
47
-
48
-
49
-
50
-
51
-
52
-
53
-
54
-
55
-
56
-
57
-
58
-
59
-
60
-
61
-
62
-
63
-
64
-
65
-
66
-
67
-
68
-
69
-
70
-
71
-
72
-
73
-
74
-
75
-
76
-
77
-
78
-
79
-
80
-
81
-
82
-
83
-
84
-
85
-
86
-
87
-
88
-
89
-
 90
90 -
 91
91 -
 92
92 -
 93
93 -
 94
94 -
 95
95 -
 96
96 -
 97
97 -
 98
98 -
 99
99 -
 100
100 -
 101
101 -
 102
102 -
 103
103 -
 104
104 -
 105
105 -
 106
106 -
 107
107 -
 108
108
 |
 |

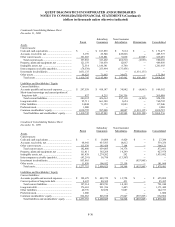
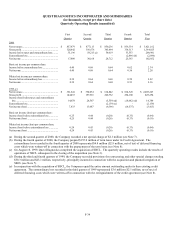
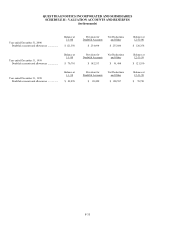
QUEST DIAGNOSTICS INCORPORATED AND SUBSIDIARIES
NOTES TO CONSOLIDATED FINANCIAL STATEMENTS (Continued)
(dollars in thousands unless otherwise indicated)
F-30
Condensed Consolidating Balance Sheet
December 31, 2000
Parent
Subsidiary
Guarantors
Non-Guarantor
Subsidiaries Eliminations Consolidated
Assets
Current assets:
Cash and cash equivalents .................................... $ -- $ 163,863 $ 7,614 $ -- $ 171,477
Accounts receivable, net....................................... 6,159 29,548 449,866 -- 485,573
Other current assets............................................... 191,693 129,881 9,030 (6,965) 323,639
Total current assets ........................................... 197,852 323,292 466,510 (6,965) 980,689
Property, plant and equipment, net ....................... 121,159 316,630 12,067 -- 449,856
Intangible assets, net ............................................ 72,514 1,180,341 8,748 -- 1,261,603
Intercompany receivable (payable) ....................... (78,538) 253,994 (175,456) -- --
Investment in subsidiaries..................................... 1,031,135 -- -- (1,031,135) --
Other assets........................................................... 66,623 71,692 34,073 -- 172,388
Total assets ....................................................... $ 1,410,745 $ 2,145,949 $ 345,942 $ (1,038,100) $ 2,864,536
Liabilities and Stockholders’ Equity
Current liabilities:
Accounts payable and accrued expenses............... $ 247,558 $ 418,147 $ 30,842 $ (6,965) $ 689,582
Short-term borrowings and current portion of
long-term debt..................................................... 837 8,215 256,356 -- 265,408
Total current liabilities...................................... 248,395 426,362 287,198 (6,965) 954,990
Long-term debt ..................................................... 95,711 661,340 3,654 -- 760,705
Other liabilities ..................................................... 34,844 71,159 11,043 -- 117,046
Preferred stock...................................................... 1,000 -- -- -- 1,000
Common stockholders’ equity .............................. 1,030,795 987,088 44,047 (1,031,135) 1,030,795
Total liabilities and stockholders’ equity.......... $ 1,410,745 $ 2,145,949 $ 345,942 $ (1,038,100) $ 2,864,536
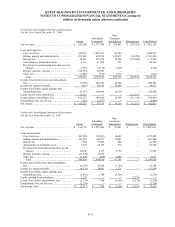
Condensed Consolidating Balance Sheet
December 31, 1999
Parent
Subsidiary
Guarantors
Non-Guarantor
Subsidiaries Eliminations Consolidated
Assets
Current assets:
Cash and cash equivalents .................................... $ -- $ 18,864 $ 8,420 $ -- $ 27,284
Accounts receivable, net....................................... 68,941 455,503 14,812 -- 539,256
Other current assets............................................... 113,539 185,438 7,144 -- 306,121
Total current assets ........................................... 182,480 659,805 30,376 -- 872,661
Property, plant and equipment, net ....................... 111,411 302,268 14,299 -- 427,978
Intangible assets, net............................................. 161,438 1,274,202 242 -- 1,435,882
Intercompany receivable (payable) ....................... (43,291) 56,798 (13,507) -- --
Investment in subsidiaries..................................... 853,865 -- -- (853,865) --
Other assets........................................................... 11,850 106,952 23,158 -- 141,960
Total assets........................................................ $ 1,277,753 $ 2,400,025 $ 54,568 $ (853,865) $ 2,878,481
Liabilities and Stockholders’ Equity
Current liabilities:
Accounts payable and accrued expenses............... $ 192,679 $ 449,372 $ 13,758 $ -- $ 655,809
Current portion of long-term debt......................... 4,635 40,369 431 -- 45,435
Total current liabilities...................................... 197,314 489,741 14,189 -- 701,244
Long-term debt ..................................................... 176,601 991,396 3,445 -- 1,171,442
Other liabilities ..................................................... 40,776 92,870 9,087 -- 142,733
Preferred stock...................................................... 1,000 -- -- -- 1,000
Common stockholders’ equity .............................. 862,062 826,018 27,847 (853,865) 862,062
Total liabilities and stockholders’ equity ......... $ 1,277,753 $ 2,400,025 $ 54,568 $ (853,865) $ 2,878,481