Quest Diagnostics 2000 Annual Report Download - page 75
Download and view the complete annual report
Please find page 75 of the 2000 Quest Diagnostics annual report below. You can navigate through the pages in the report by either clicking on the pages listed below, or by using the keyword search tool below to find specific information within the annual report.
F-5
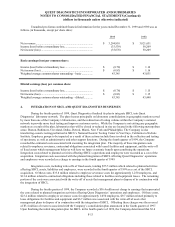
QUEST DIAGNOSTICS INCORPORATED AND SUBSIDIARIES
CONSOLIDATED STATEMENTS OF STOCKHOLDERS’ EQUITY
FOR THE YEARS ENDED DECEMBER 31, 2000, 1999 AND 1998
(in thousands)
Common
Stock
Additional
Paid-In
Capital
Accumulated
Deficit
Unearned
Compen-
sation
Accumulated
Other
Comprehensive
Income (Loss)
Treasury
Stock
Compre-
hensive
Income
(Loss)
Balance,
December 31, 1997 $ 300 $ 1,198,194 $ (650,281) $ (5,038) $ (2,515) $ -
Net income 26,885 $ 26,885
Other comprehensive loss (523) (523)
Comprehensive income 26,362
Preferred dividends declared (118)
Purchase of treasury stock (687
shares) (13,032)
Issuance of common stock under
benefit plans (255 common
shares and 473 treasury shares) 2 3,522 (970) 9,101
Adjustment to Corning receivable (710)
Amortization of unearned
compensation 2,113
Balance,
December 31, 1998 302 1,201,006 (623,514) (3,895) (3,038) (3,931)
Net loss (3,413) (3,413)
Other comprehensive income 588 588
Comprehensive loss (2,825)
Preferred dividends declared (118)
Shares issued to acquire SBCL
(12,564 shares) 126 260,584
Purchase of treasury stock (60
common shares) (1,103)
Issuance of common stock under
benefit plans (1,269 common
shares and 274 treasury shares) 13 34,991 (11,253) 5,034
Exercise of stock options (279
common shares) 3 4,426
Tax benefits associated with stock-
based compensation plans 3,529
Adjustment to Corning receivable (1,985)
Amortization of unearned
compensation 3,710
Balance,
December 31, 1999 444 1,502,551 (627,045) (11,438) (2,450) -
Net income 102,052 102,052
Other comprehensive loss (3,008) (3,008)
Comprehensive income $ 99,044
Preferred dividends declared (118)
Issuance of common stock under
benefit plans (868 common
shares) 8 58,039 (45,357)
Exercise of stock options (1,585
common shares) 16 22,131
Shares to cover employee payroll
tax withholdings on exercised
stock options (265 common
shares) (3) (22,012)
Tax benefits associated with stock-
based compensation plans 37,125
Adjustment to Corning receivable (5,858)
Amortization of unearned
compensation 25,718
Balance,
December 31, 2000 $ 465 $ 1,591,976 $ (525,111) $ (31,077) $ (5,458) $ -
The accompanying notes are an integral part of these statements.


