Quest Diagnostics 2000 Annual Report Download - page 62
Download and view the complete annual report
Please find page 62 of the 2000 Quest Diagnostics annual report below. You can navigate through the pages in the report by either clicking on the pages listed below, or by using the keyword search tool below to find specific information within the annual report.42
Quantitative and Qualitative Disclosures About Market Risk
We address our exposure to market risks, principally the market risk of changes in interest rates, through a
controlled program of risk management that includes the use of derivative financial instruments. We do not hold or issue
derivative financial instruments for trading purposes. In accordance with the terms of the Credit Agreement, we maintain
interest rate swap agreements to mitigate the risk of changes in interest rates associated with our variable rate bank debt.
We do not believe that our foreign exchange exposure and related hedging program are material to our financial position
or results of operations. See Note 2 to the Consolidated Financial Statements for additional discussion of our financial
instruments and hedging activities.
Interest Rates
At December 31, 2000 and 1999, the fair value of our debt was estimated at approximately $1.0 billion and $1.2
billion, respectively, using quoted market prices and yields for the same or similar types of borrowings, taking into
account the underlying terms of the debt instruments. At December 31, 2000, the estimated fair value exceeded the
carrying value of the debt by approximately $5 million. At December 31, 1999, the carrying value of the debt exceeded
the estimated fair value by approximately $4 million. An assumed 10% increase in interest rates (representing
approximately 100 basis points) would potentially reduce the estimated fair value of our debt by approximately $8
million and $10 million, respectively, at December 31, 2000 and 1999.
At December 31, 2000 and 1999, we had $848 million and $1,036 million, respectively, of variable interest rate
debt outstanding. The Credit Agreement requires us to mitigate the risk of changes in interest rates associated with our
variable interest rate indebtedness through the use of interest rate swap agreements. Under such arrangements, we
convert a portion of our variable rate indebtedness to fixed rates based on a notional principal amount. The settlement
dates are correlated to correspond to the interest payment dates of the hedged debt. During the term of the Credit
Agreement, the notional amounts under the interest rate swap agreements, plus the principal amount outstanding of our
fixed interest rate indebtedness, must be at least 50% of our net funded debt (as defined in the Credit Agreement). As of
December 31, 2000 and 1999, the aggregate notional principal amount under the interest rate swap agreements which
mature at various dates through November 2002 totaled $410 million and $450 million, respectively. At December 31,
2000 and 1999, the estimated fair value of the interest rate swap agreements approximated a liability of $2 million and an
asset of $4 million, respectively.
Based on our net exposure to interest rate changes, an assumed 10% increase in interest rates, (representing
approximately 100 basis points) would result in a $1.8 million reduction in our after-tax earnings and cash flows for the
year ended December 31, 2000 based on debt levels as of December 31, 2000, after considering the impact of our interest
rate swap agreements. The primary interest rate exposures on the variable interest rate debt are with respect to interest
rates on United States dollars as quoted in the London interbank market.
Liquidity and Capital Resources
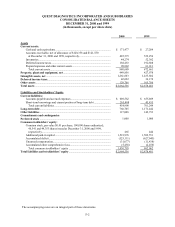
Cash and cash equivalents at December 31, 2000 totaled $171.5 million, an increase of $144.2 million from
December 31, 1999. Cash flows from operating activities in 2000 provided cash of $369.5 million, which was partially
offset by investing and financing activities which required cash of $225.3 million. We maintain zero-balance bank
accounts for the majority of our cash disbursements. Prior to the second quarter of 2000, we maintained our largest
disbursement accounts and primary concentration accounts at the same financial institution, giving that financial
institution the legal right of offset. As such, book overdrafts related to the disbursement accounts were offset against
cash balances in the concentration accounts for reporting purposes. During the second quarter of 2000, we moved our
primary concentration account to another financial institution such that no offset exists. As a result, book overdrafts in
the amount of $47.4 million at December 31, 2000, representing outstanding checks, were classified as liabilities and not
reflected as a reduction of cash at December 31, 2000. Cash and cash equivalents at December 31, 1999 totaled $27.3
million, a decrease of $175.6 million from the prior year-end balance. The decrease in cash and cash equivalents during
1999 was principally associated with the acquisition and financing of the SBCL acquisition and the repayment of the
entire amount outstanding under our then existing credit agreement. Cash flows from operating and financing activities
during 1999 provided cash of $249.5 million and $682.8 million, respectively, and were used to fund investing activities
which required cash of $1.1 billion.
Net cash from operating activities for 2000 was $119.9 million higher than the 1999 level. Of the increase, $47.4
million was due to the impact of accounting for book overdrafts discussed above, and the remaining $72.5 million
increase was primarily due to the impact of the SBCL acquisition and improvements in the operating performance of the
Company, partially offset by an increase in payments for restructuring, integration and other special charges. Net cash


