Quest Diagnostics 2000 Annual Report Download - page 55
Download and view the complete annual report
Please find page 55 of the 2000 Quest Diagnostics annual report below. You can navigate through the pages in the report by either clicking on the pages listed below, or by using the keyword search tool below to find specific information within the annual report.-
 1
1 -
2
-
3
-
4
-
5
-
6
-
7
-
8
-
9
-
10
-
11
-
12
-
13
-
14
-
15
-
16
-
17
-
18
-
19
-
20
-
21
-
22
-
23
-
24
-
25
-
26
-
27
-
28
-
29
-
30
-
31
-
32
-
33
-
34
-
35
-
36
-
37
-
38
-
39
-
40
-
41
-
42
-
43
-
44
-
 45
45 -
 46
46 -
 47
47 -
 48
48 -
 49
49 -
 50
50 -
 51
51 -
 52
52 -
 53
53 -
 54
54 -
 55
55 -
 56
56 -
 57
57 -
 58
58 -
 59
59 -
 60
60 -
 61
61 -
 62
62 -
 63
63 -
 64
64 -
 65
65 -
66
-
67
-
68
-
69
-
70
-
71
-
72
-
73
-
74
-
75
-
76
-
77
-
78
-
79
-
80
-
81
-
82
-
83
-
84
-
85
-
86
-
87
-
88
-
89
-
90
-
91
-
92
-
93
-
94
-
95
-
96
-
97
-
98
-
99
-
100
-
101
-
102
-
103
-
104
-
105
-
106
-
107
-
108
 |
 |

35
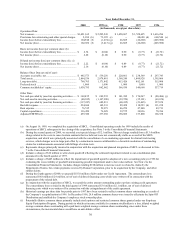
Results of Operations
The following table summarizes our historical consolidated results of operations for the years 1998 through
2000 and our unaudited pro forma combined results of operations for the year ended December 31, 1999 (in thousands,
except per share data):
Year Ended December 31,
Historical
Pro Forma
Combined
2000 1999 1998 1999
Net revenues................................................................. $ 3,421,162 $ 2,205,243 $ 1,458,607 $ 3,294,810
Costs and expenses:
Cost of services........................................................... 2,056,237 1,379,989 896,793 2,132,339
Selling, general and administrative ............................. 1,001,443 643,440 445,885 948,178
Interest, net ................................................................. 113,092 61,450 33,403 122,647
Amortization of intangible assets................................ 45,665 29,784 21,697 45,247
Provisions for restructuring and other special
charges...................................................................... 2,100 73,385 — 89,198
Minority share of income............................................ 9,359 5,431 2,017 5,431
Other, net .................................................................... (7,715) (2,620) 4,951 (13,616)
Total.......................................................................... 3,220,181 2,190,859 1,404,746 3,329,424
Income (loss) before taxes and extraordinar
y
loss .... 200,981 14,384 53,861 (34,614)
Income tax ex
p
ense (benefit) ...................................... 96,033 15,658 26,976 (1,075)
Income (loss) before extraordinar
y
loss..................... 104,948 (1,274) 26,885 (33,539)
Extraordinar
y
loss, net of taxes.................................. (2,896) (2,139) — (2,139)
Net income (loss).......................................................... $ 102,052 $ (3,413) $ 26,885 $ (35,678)
Income before extraordinary loss and special
items ........................................................................... $ 106,218 $ 41,150 $ 26,885 $ 12,581
Basic net income (loss) per common share:
Income (loss) before extraordinary loss......................... $ 2.34 $ (0.04) $ 0.90 $ (0.78)
Net income (loss) .......................................................... 2.28 (0.10) 0.90 (0.83)
Income before extraordinary loss and special items ...... 2.37 1.17 0.90 0.29
Weighted average common shares outstanding –
basic............................................................................ 44,763 35,014 29,684 43,345
Diluted net income (loss) per common share:
Income (loss) before extraordinary loss......................... $ 2.22 $ (0.04) $ 0.89 $ (0.78)
Net income (loss) .......................................................... 2.16 (0.10) 0.89 (0.83)
Income before extraordinary loss and special items ...... 2.25 1.15 0.89 0.28
Weighted average common shares outstanding –
diluted ......................................................................... 47,150 35,827 30,229 44,088
Supplemental Data:
Bad debt expense........................................................... $234,694 $ 142,333 $ 89,428 $ 258,778
Adjusted EBITDA......................................................... 459,380 237,038 158,609 337,378