Quest Diagnostics 2000 Annual Report Download - page 57
Download and view the complete annual report
Please find page 57 of the 2000 Quest Diagnostics annual report below. You can navigate through the pages in the report by either clicking on the pages listed below, or by using the keyword search tool below to find specific information within the annual report.-
 1
1 -
2
-
3
-
4
-
5
-
6
-
7
-
8
-
9
-
10
-
11
-
12
-
13
-
14
-
15
-
16
-
17
-
18
-
19
-
20
-
21
-
22
-
23
-
24
-
25
-
26
-
27
-
28
-
29
-
30
-
31
-
32
-
33
-
34
-
35
-
36
-
37
-
38
-
39
-
40
-
41
-
42
-
43
-
44
-
45
-
46
-
 47
47 -
 48
48 -
 49
49 -
 50
50 -
 51
51 -
 52
52 -
 53
53 -
 54
54 -
 55
55 -
 56
56 -
 57
57 -
 58
58 -
 59
59 -
 60
60 -
 61
61 -
 62
62 -
 63
63 -
 64
64 -
 65
65 -
 66
66 -
 67
67 -
68
-
69
-
70
-
71
-
72
-
73
-
74
-
75
-
76
-
77
-
78
-
79
-
80
-
81
-
82
-
83
-
84
-
85
-
86
-
87
-
88
-
89
-
90
-
91
-
92
-
93
-
94
-
95
-
96
-
97
-
98
-
99
-
100
-
101
-
102
-
103
-
104
-
105
-
106
-
107
-
108
 |
 |
37
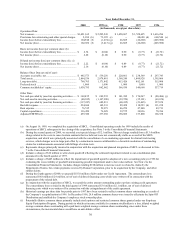
information technology strategy and bad debt expense. For the year ended December 31, 2000, bad debt expense was
7.0% of net revenues, compared to 6.7% of net revenues in the prior year period. The increase in bad debt expense was
principally attributable to SBCL’s collection experience which is less favorable than Quest Diagnostics’ historical
experience. A significant portion of the difference is due to Quest Diagnostics’ processes in the billing area, most
notably the processes around the collection of diagnosis, patient and insurance information necessary to effectively bill
for services performed. We have made significant progress towards improving the overall bad debt experience of the
combined company with quarter to quarter improvements in bad debt expense throughout 2000. Based on prior
experience as well as the sharing of internal best practices in the billing functions, we believe that substantial
opportunities continue to exist to improve our overall collection experience.
Interest, Net
Net interest expense increased from the prior year by $51.6 million. Net interest expense for the year ended
December 31, 1999 included $1.9 million of interest income associated with a favorable state tax settlement. The
remaining increase was principally attributable to the amounts borrowed under the Credit Agreement in conjunction with
the SBCL acquisition.
Amortization of Intangible Assets
Amortization of intangible assets increased from the prior year by $15.9 million for the year ended December
31, 2000, principally as a result of the SBCL acquisition.
Provisions for Restructuring and Other Special Charges
During the second quarter of 2000, we recorded a net special charge of $2.1 million. Of the special charge,
$13.4 million represented the costs to cancel certain contracts that we believed were not economically viable as a result of
the SBCL acquisition. These costs were principally associated with the cancellation of a co-marketing agreement for
clinical trials testing services. These charges were in large part offset by a reduction in reserves attributable to a
favorable resolution of outstanding claims for reimbursements associated with billings of certain tests.
During the third quarter of 2000, we reviewed our remaining restructuring reserves initially recorded in the
fourth quarter of 1999 and revised certain estimates relative to integration activities, which resulted in a $2.1 million
reduction in accruals associated with planned restructuring activities affecting Quest Diagnostics’ operations and
employees. These revisions were principally associated with lower costs for employee severance and reduced costs to
exit certain leased facilities. This reduction in accruals was offset by a charge to write-off fixed assets used in the
operations of Quest Diagnostics which we believe will have no future economic benefit as a result of combining the
operations of SBCL and Quest Diagnostics.
The reduction in employee severance costs was primarily attributable to higher than anticipated volume growth
and higher than expected voluntary turnover, which reduced the number of planned severances, principally in the New
York and Philadelphia metropolitan areas. The greater than anticipated volume growth in these regions allowed the
Company to reassign to other positions individuals who would have otherwise been severed. The higher than expected
voluntary turnover was a result of delays in the integration process which were outside our control and stemmed from
protracted contract renegotiations with a major customer, and construction delays. These reductions were partially offset
by the elimination of certain senior management positions, which increased the average cost of severance benefits per
employee.
The reduction in costs to exit leased facilities is primarily related to our New York metropolitan area operations
to reflect revised assumptions related to the costs to be paid to exit leased facilities.
While our original plan anticipated completion by the end of December 31, 2000, certain factors outside our
control such as the protracted negotiations related to contractual obligations and unexpected construction delays at two of
our laboratories have prevented us from completing our plans within a one year time frame. Management expects to
substantially complete the planned integration of the Company’s principal laboratories early in the second quarter of
2001 in all major markets.