Quest Diagnostics 2000 Annual Report Download - page 103
Download and view the complete annual report
Please find page 103 of the 2000 Quest Diagnostics annual report below. You can navigate through the pages in the report by either clicking on the pages listed below, or by using the keyword search tool below to find specific information within the annual report.-
 1
1 -
2
-
3
-
4
-
5
-
6
-
7
-
8
-
9
-
10
-
11
-
12
-
13
-
14
-
15
-
16
-
17
-
18
-
19
-
20
-
21
-
22
-
23
-
24
-
25
-
26
-
27
-
28
-
29
-
30
-
31
-
32
-
33
-
34
-
35
-
36
-
37
-
38
-
39
-
40
-
41
-
42
-
43
-
44
-
45
-
46
-
47
-
48
-
49
-
50
-
51
-
52
-
53
-
54
-
55
-
56
-
57
-
58
-
59
-
60
-
61
-
62
-
63
-
64
-
65
-
66
-
67
-
68
-
69
-
70
-
71
-
72
-
73
-
74
-
75
-
76
-
77
-
78
-
79
-
80
-
81
-
82
-
83
-
84
-
85
-
86
-
87
-
88
-
89
-
90
-
91
-
92
-
 93
93 -
 94
94 -
 95
95 -
 96
96 -
 97
97 -
 98
98 -
 99
99 -
 100
100 -
 101
101 -
 102
102 -
 103
103 -
 104
104 -
 105
105 -
 106
106 -
 107
107 -
 108
108
 |
 |

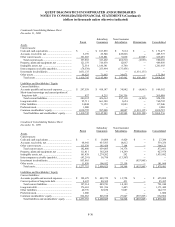
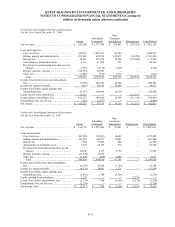
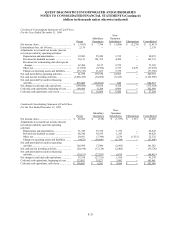
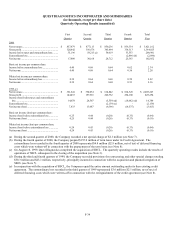
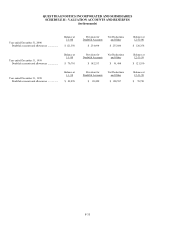
QUEST DIAGNOSTICS INCORPORATED AND SUBSIDIARIES
NOTES TO CONSOLIDATED FINANCIAL STATEMENTS (Continued)
(dollars in thousands unless otherwise indicated)
F-33
Condensed Consolidating Statement of Cash Flows
For the Year Ended December 31, 1999
Parent
Subsidiary
Guarantors
Non-
Guarantor
Subsidiaries Eliminations Consolidated
Net income (loss) .................................................... $ (3,413) $ 7,784 $ (5,506) $ (2,278) $ (3,413)
Extraordinary loss, net of taxes............................... 2,139 -- -- -- 2,139
Adjustments to reconcile net income (loss) to
net cash provided by operating activities:
Depreciation and amortization............................ 32,083 55,020 3,732 -- 90,835
Provision for doubtful accounts ......................... 36,121 101,762 4,450 -- 142,333
Provisions for restructuring and other special
charges............................................................... 62,496 8,137 2,752 -- 73,385
Other, net............................................................. (15,039) (8,954) 3,737 2,278 (17,978)
Changes in operating assets and liabilities ......... (53,317) 11,821 3,730 -- (37,766)
Net cash provided by operating activities............... 61,070 175,570 12,895 -- 249,535
Net cash used in investing activities ....................... (1,068,476) (30,099) (9,415) -- (1,107,990)
Net cash provided by (used in) financing
activities............................................................... 816,800 (134,813) 844 -- 682,831
Net change in cash and cash equivalents................ (190,606) 10,658 4,324 -- (175,624)
Cash and cash equivalents, beginning of year........ 190,606 8,206 4,096 -- 202,908
Cash and cash equivalents, end of year .................. $ -- $ 18,864 $ 8,420 $ -- $ 27,284
Condensed Consolidating Statement of Cash Flows
For the Year Ended December 31, 1998
Parent
Subsidiary
Guarantors
Non-
Guarantor
Subsidiaries Eliminations Consolidated
Net income (loss) .................................................... $ 26,885 $ (158) $ (1,357) $ 1,515 $ 26,885
Adjustments to reconcile net income (loss) to
net cash provided by (used in) operating
activities:
Depreciation and amortization............................ 31,749 35,339 1,757 -- 68,845
Provision for doubtful accounts ......................... 48,246 39,935 1,247 -- 89,428
Other, net............................................................. 29,691 (7,390) 2,536 (1,515) 23,322
Changes in operating assets and liabilities ......... (9,672) (50,640) (6,786) -- (67,098)
Net cash provided by (used in) operating
activities............................................................... 126,899 17,086 (2,603) -- 141,382
Net cash used in investing activities ....................... (20,194) (17,124) (2,402) -- (39,720)
Net cash provided by (used in) financing
activities............................................................... (39,151) (27,283) 6,019 -- (60,415)
Net change in cash and cash equivalents................ 67,554 (27,321) 1,014 -- 41,247
Cash and cash equivalents, beginning of year........ 123,052 35,527 3,082 -- 161,661
Cash and cash equivalents, end of year .................. $ 190,606 $ 8,206 $ 4,096 $ -- $ 202,908