Quest Diagnostics 2000 Annual Report Download - page 104
Download and view the complete annual report
Please find page 104 of the 2000 Quest Diagnostics annual report below. You can navigate through the pages in the report by either clicking on the pages listed below, or by using the keyword search tool below to find specific information within the annual report.-
 1
1 -
2
-
3
-
4
-
5
-
6
-
7
-
8
-
9
-
10
-
11
-
12
-
13
-
14
-
15
-
16
-
17
-
18
-
19
-
20
-
21
-
22
-
23
-
24
-
25
-
26
-
27
-
28
-
29
-
30
-
31
-
32
-
33
-
34
-
35
-
36
-
37
-
38
-
39
-
40
-
41
-
42
-
43
-
44
-
45
-
46
-
47
-
48
-
49
-
50
-
51
-
52
-
53
-
54
-
55
-
56
-
57
-
58
-
59
-
60
-
61
-
62
-
63
-
64
-
65
-
66
-
67
-
68
-
69
-
70
-
71
-
72
-
73
-
74
-
75
-
76
-
77
-
78
-
79
-
80
-
81
-
82
-
83
-
84
-
85
-
86
-
87
-
88
-
89
-
90
-
91
-
92
-
93
-
 94
94 -
 95
95 -
 96
96 -
 97
97 -
 98
98 -
 99
99 -
 100
100 -
 101
101 -
 102
102 -
 103
103 -
 104
104 -
 105
105 -
 106
106 -
 107
107 -
 108
108
 |
 |

F-34
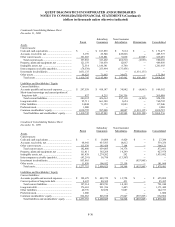
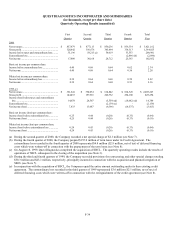
QUEST DIAGNOSTICS INCORPORATED AND SUBSIDIARIES
(in thousands, except per share data)
Quarterly Operating Results (unaudited)
First
Quarter
Second
Quarter
Third
Quarter
Fourth
Quarter
Total
Year
2000
Net revenues.......................................................... $ 857,479 $ 877,113 $ 850,236 $ 836,334 $ 3,421,162
Gross profit ........................................................... 328,442 356,676 345,494 334,313 1,364,925
Income before taxes and extraordinary loss......... 35,196 58,213 (a) 54,019 53,553 200,981
Extraordinary loss ................................................. - - - (2,896) (b) (2,896)
Net income ............................................................ 17,809 30,168 28,712 25,363 102,052
Basic net income per common share:
Income before extraordinary loss ......................... 0.40 0.68 0.64 0.62 2.34
Net income............................................................ 0.40 0.68 0.64 0.56 2.28
Diluted net income per common share:
Income before extraordinary loss ......................... 0.39 0.64 0.60 0.59 2.22
Net income............................................................ 0.39 0.64 0.60 0.53 2.16
1999 (c)
Net revenues.......................................................... $ 381,841 $ 394,034 $ 614,842 $ 814,526 $ 2,205,243
Gross profit ........................................................... 144,433 157,963 228,752 294,106 825,254
Income (loss) before taxes and extraordinary
loss .................................................................... 14,078 24,507 (5,559) (d) (18,642) (d) 14,384
Extraordinary loss................................................. - - (2,139) (e) - (2,139)
Net income (loss) .................................................. 7,433 13,087 (9,396) (14,537) (3,413)
Basic net income (loss) per common share:
Income (loss) before extraordinary loss ............... 0.25 0.44 (0.20) (0.33) (0.04)
Net income (loss) .................................................. 0.25 0.44 (0.26) (0.33) (0.10)
Diluted net income (loss) per common share:
Income (loss) before extraordinary loss ............... 0.24 0.43 (0.20) (0.33) (0.04)
Net income (loss) .................................................. 0.24 0.43 (0.26) (0.33) (0.10)
(a) During the second quarter of 2000, the Company recorded a net special charge of $2.1 million (see Note 7).
(b) During the fourth quarter of 2000, the Company prepaid $155.0 million of term loans under its Credit Agreement. The
extraordinary loss recorded in the fourth quarter of 2000 represented $4.8 million ($2.9 million, net of tax) of deferred financing
costs which were written-off in connection with the prepayment of the term loans (see Note 8).
(c) On August 16, 1999, Quest Diagnostics completed the acquisition of SBCL. The quarterly operating results include the results of
operations of SBCL subsequent to the closing of the acquisition (see Note 3).
(d) During the third and fourth quarters of 1999, the Company recorded provisions for restructuring and other special charges totaling
$30.3 million and $43.1 million, respectively, principally incurred in connection with the acquisition and planned integration of
SBCL (see Note 7).
(e) In conjunction with the acquisition of SBCL, the Company repaid the entire amount outstanding under its then existing credit
agreement. The extraordinary loss recorded in the third quarter of 1999 represented $3.6 million ($2.1 million, net of tax) of
deferred financing costs which were written-off in connection with the extinguishment of the credit agreement (see Note 8).