Priceline 2014 Annual Report Download - page 99
Download and view the complete annual report
Please find page 99 of the 2014 Priceline annual report below. You can navigate through the pages in the report by either clicking on the pages listed below, or by using the keyword search tool below to find specific information within the annual report.-
 1
1 -
2
-
3
-
4
-
5
-
6
-
7
-
8
-
9
-
10
-
11
-
12
-
13
-
14
-
15
-
16
-
17
-
18
-
19
-
20
-
21
-
22
-
23
-
24
-
25
-
26
-
27
-
28
-
29
-
30
-
31
-
32
-
33
-
34
-
35
-
36
-
37
-
38
-
39
-
40
-
41
-
42
-
43
-
44
-
45
-
46
-
47
-
48
-
49
-
50
-
51
-
52
-
53
-
54
-
55
-
56
-
57
-
58
-
59
-
60
-
61
-
62
-
63
-
64
-
65
-
66
-
67
-
68
-
69
-
70
-
71
-
72
-
73
-
74
-
75
-
76
-
77
-
78
-
79
-
80
-
81
-
82
-
83
-
84
-
85
-
86
-
87
-
88
-
 89
89 -
 90
90 -
 91
91 -
 92
92 -
 93
93 -
 94
94 -
 95
95 -
 96
96 -
 97
97 -
 98
98 -
 99
99 -
 100
100 -
 101
101 -
 102
102 -
 103
103 -
 104
104 -
 105
105 -
 106
106 -
 107
107 -
 108
108 -
 109
109 -
110
-
111
-
112
-
113
-
114
-
115
-
116
-
117
-
118
-
119
-
120
-
121
-
122
-
123
-
124
-
125
-
126
-
127
-
128
-
129
-
130
-
131
-
132
-
133
-
134
-
135
-
136
-
137
-
138
-
139
-
140
-
141
-
142
-
143
-
144
-
145
-
146
-
147
-
148
-
149
-
150
-
151
-
152
-
153
-
154
-
155
-
156
-
157
-
158
-
159
-
160
 |
 |

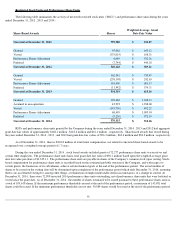
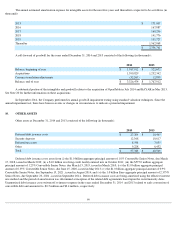
The following table summarizes, by major security type, the Company's short-term investments as of December 31, 2013 (in
thousands):
The Company has classified its investments as available-for-sale securities. These securities are carried at estimated fair value with the
aggregate unrealized gains and losses related to these investments, net of taxes, reflected as a part of "Accumulated other comprehensive income
(loss)" on the Consolidated Balance Sheets. Classification as short-term or long-term is based upon the maturity of the debt securities.
There were no significant realized gains or losses related to investments for the years ended December 31, 2014 , 2013 and 2012 .
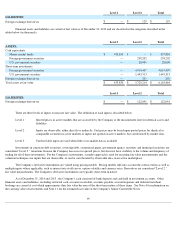
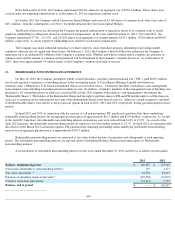
Financial assets and liabilities are carried at fair value as of December 31, 2014 and are classified in the categories described in the
tables below (in thousands):
94
Cost
Gross
Unrealized
Gains
Gross
Unrealized
Losses
Fair Value
Available for sale securities:
Short-term investments:
Foreign government securities
$
4,019,530
$
233
$
(356
)
$
4,019,407
U.S. government securities
1,443,083
250
(20
)
1,443,313
Total
$
5,462,613
$
483
$
(376
)
$
5,462,720
5.
FAIR VALUE MEASUREMENTS
Level 1
Level 2
Total
ASSETS:
Cash equivalents:
Money market funds
$
155,608
$
—
$
155,608
Foreign government securities
—
974,855
974,855
U.S. government securities
—
676,503
676,503
U.S. commercial paper
—
427,884
427,884
U.S. government agency securities
—
10,000
10,000
Short-term investments:
Foreign government securities
—
52,490
52,490
U.S. government securities
—
364,266
364,266
U.S. commercial paper
—
620,615
620,615
U.S. government agency securities
—
104,811
104,811
Foreign exchange derivatives
—
336
336
Long-term investments:
Foreign government securities
—
12,671
12,671
U.S. government securities
—
556,448
556,448
U.S. corporate debt securities
—
2,329,033
2,329,033
U.S. government agency securities
—
95,094
95,094
U.S. municipal securities
—
1,102
1,102
Ctrip corporate debt securities
—
425,961
425,961
Ctrip equity securities
335,344
—
335,344
Total assets at fair value
$
490,952
$
6,652,069
$
7,143,021