Priceline 2014 Annual Report Download - page 86
Download and view the complete annual report
Please find page 86 of the 2014 Priceline annual report below. You can navigate through the pages in the report by either clicking on the pages listed below, or by using the keyword search tool below to find specific information within the annual report.
The Priceline Group Inc.
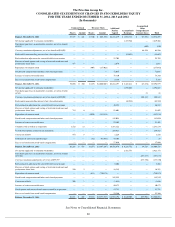
CONSOLIDATED STATEMENTS OF CHANGES IN STOCKHOLDERS' EQUITY
FOR THE YEARS ENDED DECEMBER 31, 2014, 2013 and 2012
(In thousands)
See Notes to Consolidated Financial Statements.
82
Common Stock
Treasury Stock
Additional
Paid-in
Capital
Accumulated
Earnings
Accumulated
Other
Comprehensive
Income (Loss)
Total
Shares
Amount
Shares
Amount
Balance, December 31, 2011
57,579
$
446
(7,780
)
$
(803,586
)
$
2,431,279
$
1,033,738
$
(87,582
)
$
2,574,295
Net income applicable to common stockholders —
—
—
—
—
1,419,566
—
1,419,566
Unrealized gain (loss) on marketable securities, net of tax benefit
of $158 —
—
—
—
—
—
(
620
)
(620
)
Currency translation adjustments, net of tax benefit of $18,001 —
—
—
—
—
—
64,526
64,526
Redeemable noncontrolling interests fair value adjustments —
—
—
—
—
(
84,693
)
—
(
84,693
)
Reclassification adjustment for convertible debt in mezzanine —
—
—
—
22,705
—
—
22,705
Exercise of stock options and vesting of restricted stock units and
performance share units
477
4
—
—
2,679
—
—
2,683
Repurchase of common stock —
—
(
405
)
(257,021
)
—
—
—
(
257,021
)
Stock-based compensation and other stock-based payments —
—
—
—
72,035
—
—
72,035
Issuance of senior convertible notes —
—
—
—
78,310
—
—
78,310
Excess tax benefit from stock-based compensation —
—
—
—
5,189
—
—
5,189
Balance, December 31, 2012
58,056
$
450
(8,185
)
$
(1,060,607
)
$
2,612,197
$
2,368,611
$
(23,676
)
$
3,896,975
Net income applicable to common stockholders —
—
—
—
—
1,892,663
—
1,892,663
Unrealized gain (loss) on marketable securities, net of tax benefit
of $43 —
—
—
—
—
—
21
21
Currency translation adjustments, net of tax benefit of $55,001 —
—
—
—
—
—
108,384
108,384
Redeemable noncontrolling interests fair value adjustments —
—
—
—
—
(
42,522
)
—
(
42,522
)
Reclassification adjustment for convertible debt in mezzanine —
—
—
—
46,122
—
—
46,122
Exercise of stock options and vesting of restricted stock units and
performance share units
715
6
—
—
91,601
—
—
91,607
Repurchase of common stock —
—
(
1,030
)
(883,515
)
—
—
—
(
883,515
)
Stock-based compensation and other stock-based payments —
—
—
—
142,098
—
—
142,098
Issuance of senior convertible notes —
—
—
—
93,402
—
—
93,402
Common stock issued in an acquisition
1,522
12
—
—
1,281,122
—
—
1,281,134
Vested stock options assumed in an acquisition —
—
—
—
264,423
—
—
264,423
Conversion of debt
972
8
—
—
1,224
—
—
1,232
Settlement of conversion spread hedges —
—
(
42
)
(43,085
)
43,104
—
—
19
Excess tax benefit from stock-based compensation —
—
—
—
17,686
—
—
17,686
Balance, December 31, 2013
61,265
$
476
(9,257
)
$
(1,987,207
)
$
4,592,979
$
4,218,752
$
84,729
$
6,909,729
Net income applicable to common stockholders —
—
—
—
—
2,421,753
—
2,421,753
Unrealized gain (loss) on marketable securities, net of tax benefit
of $7,621 —
—
—
—
—
—
(
157,275
)
(157,275
)
Currency translation adjustments, net of tax of $55,597 —
—
—
—
—
—
(
187,356
)
(187,356
)
Reclassification adjustment for convertible debt in mezzanine —
—
—
—
8,204
—
—
8,204
Exercise of stock options and vesting of restricted stock units and
performance share units
256
2
—
—
16,389
—
—
16,391
Repurchase of common stock —
—
(
631
)
(750,378
)
—
—
—
(
750,378
)
Stock-based compensation and other stock-based payments —
—
—
—
189,292
—
—
189,292
Conversion of debt
300
2
—
—
(
1,658
)
—
—
(
1,656
)
Issuance of senior convertible notes —
—
—
—
80,873
—
—
80,873
Stock options and restricted stock units assumed in acquisitions —
—
—
—
13,751
—
—
13,751
Excess tax benefit from stock-based compensation —
—
—
—
23,366
—
—
23,366
Balance, December 31, 2014
61,821
$
480
(9,888
)
$
(2,737,585
)
$
4,923,196
$
6,640,505
$
(259,902
)
$
8,566,694


