Priceline 2014 Annual Report Download - page 67
Download and view the complete annual report
Please find page 67 of the 2014 Priceline annual report below. You can navigate through the pages in the report by either clicking on the pages listed below, or by using the keyword search tool below to find specific information within the annual report.-
 1
1 -
2
-
3
-
4
-
5
-
6
-
7
-
8
-
9
-
10
-
11
-
12
-
13
-
14
-
15
-
16
-
17
-
18
-
19
-
20
-
21
-
22
-
23
-
24
-
25
-
26
-
27
-
28
-
29
-
30
-
31
-
32
-
33
-
34
-
35
-
36
-
37
-
38
-
39
-
40
-
41
-
42
-
43
-
44
-
45
-
46
-
47
-
48
-
49
-
50
-
51
-
52
-
53
-
54
-
55
-
56
-
 57
57 -
 58
58 -
 59
59 -
 60
60 -
 61
61 -
 62
62 -
 63
63 -
 64
64 -
 65
65 -
 66
66 -
 67
67 -
 68
68 -
 69
69 -
 70
70 -
 71
71 -
 72
72 -
 73
73 -
 74
74 -
 75
75 -
 76
76 -
 77
77 -
78
-
79
-
80
-
81
-
82
-
83
-
84
-
85
-
86
-
87
-
88
-
89
-
90
-
91
-
92
-
93
-
94
-
95
-
96
-
97
-
98
-
99
-
100
-
101
-
102
-
103
-
104
-
105
-
106
-
107
-
108
-
109
-
110
-
111
-
112
-
113
-
114
-
115
-
116
-
117
-
118
-
119
-
120
-
121
-
122
-
123
-
124
-
125
-
126
-
127
-
128
-
129
-
130
-
131
-
132
-
133
-
134
-
135
-
136
-
137
-
138
-
139
-
140
-
141
-
142
-
143
-
144
-
145
-
146
-
147
-
148
-
149
-
150
-
151
-
152
-
153
-
154
-
155
-
156
-
157
-
158
-
159
-
160
 |
 |

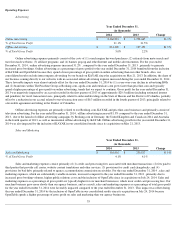
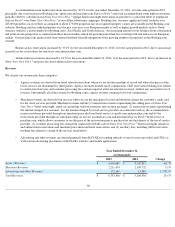
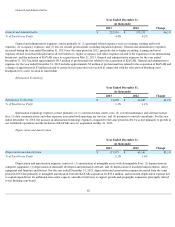
Other Income (Expense)
For the year ended December 31, 2013, interest income on cash and marketable securities increased over the same period in 2012,
primarily due to an increase in the average invested balance partially offset by lower yields. Interest expense increased for the year ended
December 31, 2013 as compared to the same period in 2012, primarily due to an increase in the average outstanding debt resulting from the May
2013 issuance of $1.0 billion aggregate principal amount of convertible senior notes and the March 2012 issuance of $1.0 billion aggregate
principal amount of convertible senior notes.
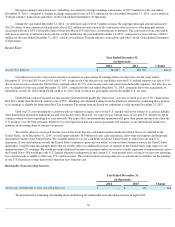
Derivative contracts that hedge our exposure to the impact of currency fluctuations on the translation of our international operating
results into U.S. Dollars upon consolidation resulted in foreign exchange gains of $0.3 million for the year ended December 31, 2013 compared
with foreign exchange gains of $0.7 million for the year ended December 31, 2012, and are recorded in "Foreign currency transactions and
other" on the Consolidated Statements of Operations.
Foreign exchange transaction losses, including costs related to foreign exchange transactions, resulted in losses of $10.2 million for the
year ended December 31, 2013, compared to foreign exchange transaction losses of $10.5 million for the year ended December 31, 2012, and are
recorded in "Foreign currency transactions and other" on the Consolidated Statements of Operations.
During the fourth quarter of 2013, the Company delivered cash of $414.6 million to repay the aggregate principal amount and issued
972,235 shares of its common stock in satisfaction of the conversion value in excess of the principal amount associated with the 1.25%
Convertible Senior Notes due March 2015 that were converted prior to maturity. The conversion of our convertible debt prior to maturity
resulted in a non-cash loss of $26.7 million for the year ended December 31, 2013, and is recorded in "Foreign currency transactions and other"
on the Consolidated Statements of Operations.
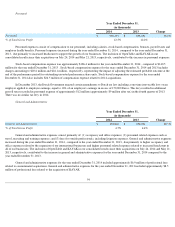
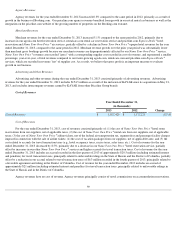
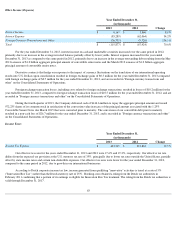
Income Taxes
Our effective tax rates for the years ended December 31, 2013 and 2012 were 17.6% and 19.2%, respectively. Our effective tax rate
differs from the expected tax provision at the U.S. statutory tax rate of 35%, principally due to lower tax rates outside the United States, partially
offset by state income taxes and certain non-deductible expenses. Our effective tax rates were lower for the year ended December 31, 2013,
compared to the same period in 2012, due to growth in our international businesses.
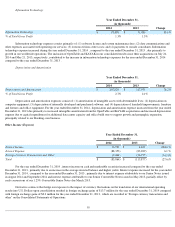
According to Dutch corporate income tax law, income generated from qualifying "innovative" activities is taxed at a rate of 5%
("Innovation Box Tax") rather than the Dutch statutory rate of 25%. Booking.com obtained a ruling from the Dutch tax authorities in
February 2011 confirming that a portion of its earnings is eligible for Innovation Box Tax treatment. The ruling from the Dutch tax authorities is
valid through December 31, 2017.
63
Year Ended December 31,
(in thousands)
2013
2012
Change
Interest Income
$
4,167
$
3,860
8.0
%
Interest Expense
(83,289
)
(62,064
)
34.2
%
Foreign Currency Transactions and Other
(36,755
)
(9,720
)
278.1
%
Total
$
(115,877
)
$
(67,924
)
70.6
%
Year Ended December 31,
(in thousands)
2013
2012
Change
Income Tax Expense
$
403,739
$
337,832
19.5
%