Priceline 2014 Annual Report Download - page 120
Download and view the complete annual report
Please find page 120 of the 2014 Priceline annual report below. You can navigate through the pages in the report by either clicking on the pages listed below, or by using the keyword search tool below to find specific information within the annual report.-
 1
1 -
2
-
3
-
4
-
5
-
6
-
7
-
8
-
9
-
10
-
11
-
12
-
13
-
14
-
15
-
16
-
17
-
18
-
19
-
20
-
21
-
22
-
23
-
24
-
25
-
26
-
27
-
28
-
29
-
30
-
31
-
32
-
33
-
34
-
35
-
36
-
37
-
38
-
39
-
40
-
41
-
42
-
43
-
44
-
45
-
46
-
47
-
48
-
49
-
50
-
51
-
52
-
53
-
54
-
55
-
56
-
57
-
58
-
59
-
60
-
61
-
62
-
63
-
64
-
65
-
66
-
67
-
68
-
69
-
70
-
71
-
72
-
73
-
74
-
75
-
76
-
77
-
78
-
79
-
80
-
81
-
82
-
83
-
84
-
85
-
86
-
87
-
88
-
89
-
90
-
91
-
92
-
93
-
94
-
95
-
96
-
97
-
98
-
99
-
100
-
101
-
102
-
103
-
104
-
105
-
106
-
107
-
108
-
109
-
 110
110 -
 111
111 -
 112
112 -
 113
113 -
 114
114 -
 115
115 -
 116
116 -
 117
117 -
 118
118 -
 119
119 -
 120
120 -
 121
121 -
 122
122 -
 123
123 -
 124
124 -
 125
125 -
 126
126 -
 127
127 -
 128
128 -
 129
129 -
 130
130 -
131
-
132
-
133
-
134
-
135
-
136
-
137
-
138
-
139
-
140
-
141
-
142
-
143
-
144
-
145
-
146
-
147
-
148
-
149
-
150
-
151
-
152
-
153
-
154
-
155
-
156
-
157
-
158
-
159
-
160
 |
 |

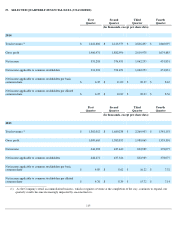
19. SELECTED QUARTERLY FINANCIAL DATA (UNAUDITED)
_____________________________
(1)
As the Company's retail accommodation business, which recognizes revenue at the completion of the stay, continues to expand, our
quarterly results become increasingly impacted by seasonal factors.
115
First
Quarter
Second
Quarter
Third
Quarter
Fourth
Quarter
(In thousands, except per share data)
2014
Total revenues
(1)
$
1,641,802
$
2,123,575
$
2,836,497
$
1,840,097
Gross profit
1,406,471
1,882,996
2,619,978
1,674,685
Net income
331,218
576,451
1,062,253
451,831
Net income applicable to common stockholders
331,218
576,451
1,062,253
451,831
Net income applicable to common stockholders per basic
common share
$
6.35
$
11.00
$
20.27
$
8.65
Net income applicable to common stockholders per diluted
common share
$
6.25
$
10.89
$
20.03
$
8.56
First
Quarter
Second
Quarter
Third
Quarter
Fourth
Quarter
(In thousands, except per share data)
2013
Total revenues
(1)
$
1,302,012
$
1,680,238
$
2,269,903
$
1,541,153
Gross profit
1,009,665
1,383,855
1,989,065
1,333,301
Net income
244,292
437,440
832,989
378,077
Net income applicable to common stockholders
244,271
437,326
832,989
378,077
Net income applicable to common stockholders per basic
common share
$
4.89
$
8.62
$
16.22
$
7.32
Net income applicable to common stockholders per diluted
common share
$
4.76
$
8.39
$
15.72
$
7.14