Priceline 2014 Annual Report Download - page 66
Download and view the complete annual report
Please find page 66 of the 2014 Priceline annual report below. You can navigate through the pages in the report by either clicking on the pages listed below, or by using the keyword search tool below to find specific information within the annual report.-
 1
1 -
2
-
3
-
4
-
5
-
6
-
7
-
8
-
9
-
10
-
11
-
12
-
13
-
14
-
15
-
16
-
17
-
18
-
19
-
20
-
21
-
22
-
23
-
24
-
25
-
26
-
27
-
28
-
29
-
30
-
31
-
32
-
33
-
34
-
35
-
36
-
37
-
38
-
39
-
40
-
41
-
42
-
43
-
44
-
45
-
46
-
47
-
48
-
49
-
50
-
51
-
52
-
53
-
54
-
55
-
 56
56 -
 57
57 -
 58
58 -
 59
59 -
 60
60 -
 61
61 -
 62
62 -
 63
63 -
 64
64 -
 65
65 -
 66
66 -
 67
67 -
 68
68 -
 69
69 -
 70
70 -
 71
71 -
 72
72 -
 73
73 -
 74
74 -
 75
75 -
 76
76 -
77
-
78
-
79
-
80
-
81
-
82
-
83
-
84
-
85
-
86
-
87
-
88
-
89
-
90
-
91
-
92
-
93
-
94
-
95
-
96
-
97
-
98
-
99
-
100
-
101
-
102
-
103
-
104
-
105
-
106
-
107
-
108
-
109
-
110
-
111
-
112
-
113
-
114
-
115
-
116
-
117
-
118
-
119
-
120
-
121
-
122
-
123
-
124
-
125
-
126
-
127
-
128
-
129
-
130
-
131
-
132
-
133
-
134
-
135
-
136
-
137
-
138
-
139
-
140
-
141
-
142
-
143
-
144
-
145
-
146
-
147
-
148
-
149
-
150
-
151
-
152
-
153
-
154
-
155
-
156
-
157
-
158
-
159
-
160
 |
 |
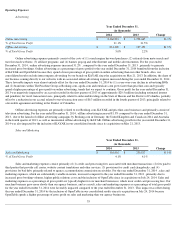
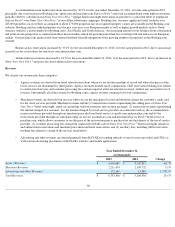
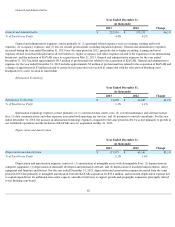
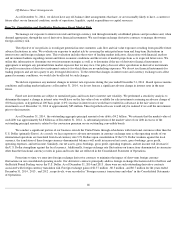
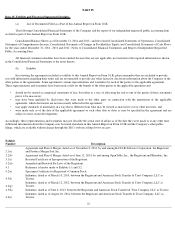
General and Administrative
General and administrative expenses consist primarily of: (1) personnel related expenses such as recruiting, training and travel
expenses; (2) occupancy expenses; and (3) fees for outside professionals, including litigation expenses. General and administrative expenses
increased during the year ended December 31, 2013 over the same period in 2012, primarily due to higher recruiting, training and travel
expenses related to increased headcount in all our businesses, higher occupancy and office expenses related to the expansion of our international
businesses, and the inclusion of KAYAK since its acquisition on May 21, 2013. General and administrative expenses for the year ended
December 31, 2013 included approximately $8.5 million of professional fees related to the acquisition of KAYAK. General and administrative
expenses for the year ended December 31, 2012 includes approximately $3 million of professional fees related to the acquisition of KAYAK and
a charge of approximately $3 million related to certain leased space that was vacated in connection with the relocation of Booking.com's
headquarters to a new location in Amsterdam.
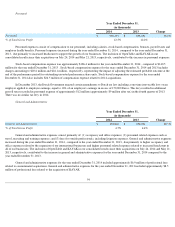
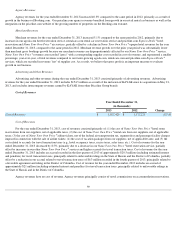
Information Technology
Information technology expenses consist primarily of: (1) outsourced data center costs; (2) system maintenance and software license
fees; (3) data communications and other expenses associated with operating our services; and (4) payments to outside consultants. For the year
ended December 31, 2013, the increase in information technology expenses compared to the same period in 2012 was due primarily to growth in
our worldwide operations and the inclusion of KAYAK since its acquisition on May 21, 2013.
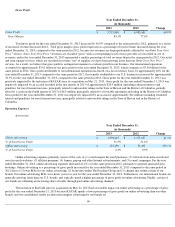
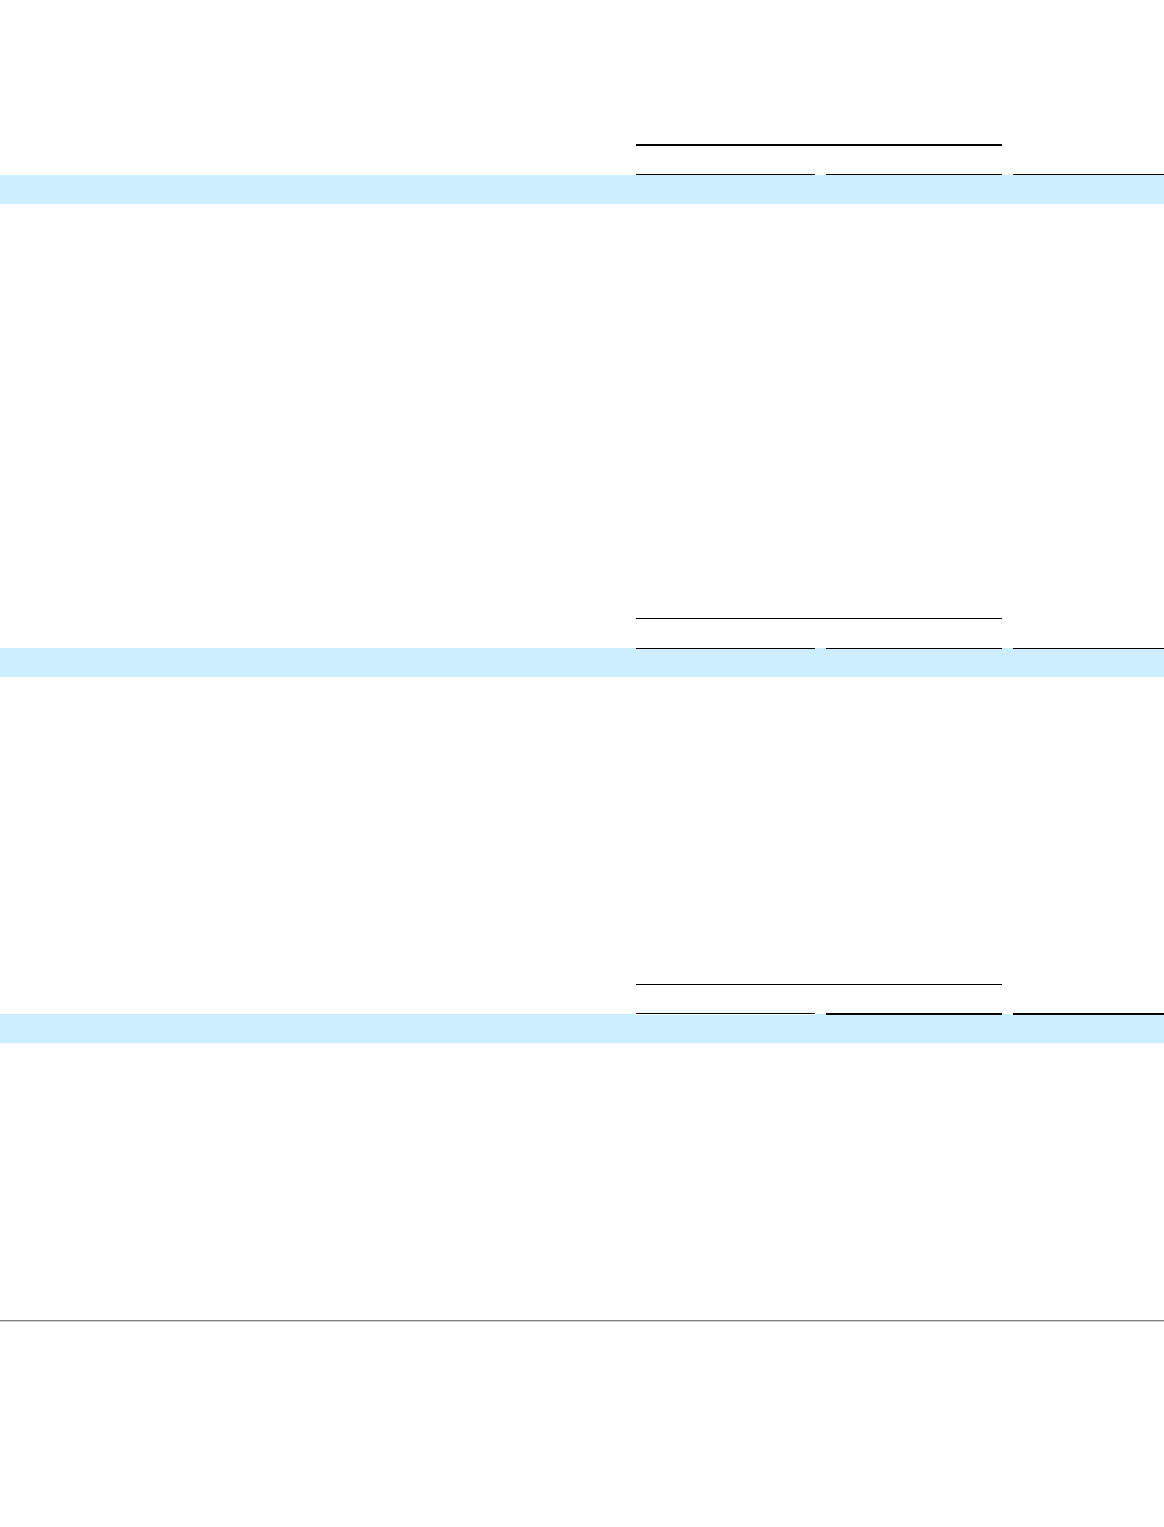
Depreciation and Amortization
Depreciation and amortization expenses consist of: (1) amortization of intangible assets with determinable lives; (2) depreciation on
computer equipment; (3) depreciation of internally developed and purchased software; and (4) depreciation of leasehold improvements, office
equipment and furniture and fixtures. For the year ended December 31, 2013, depreciation and amortization expense increased from the same
period in 2012 due primarily to intangible amortization from the KAYAK acquisition for $33.4 million, and increased depreciation expense due
to capital expenditures for additional data center capacity and office build outs to support growth and geographic expansion, principally related
to our Booking.com brand.
62
Year Ended December 31,
(in thousands)
2013
2012
Change
General and Administrative
$
252,994
$
173,171
46.1
%
% of Total Gross Profit
4.4
%
4.2
%
Year Ended December 31,
(in thousands)
2013
2012
Change
Information Technology
$
71,890
$
43,685
64.6
%
% of Total Gross Profit
1.3
%
1.1
%
Year Ended December 31,
(in thousands)
2013
2012
Change
Depreciation and Amortization
$
117,975
$
65,141
81.1
%
% of Total Gross Profit
2.1
%
1.6
%