Priceline 2014 Annual Report Download - page 56
Download and view the complete annual report
Please find page 56 of the 2014 Priceline annual report below. You can navigate through the pages in the report by either clicking on the pages listed below, or by using the keyword search tool below to find specific information within the annual report.-
 1
1 -
2
-
3
-
4
-
5
-
6
-
7
-
8
-
9
-
10
-
11
-
12
-
13
-
14
-
15
-
16
-
17
-
18
-
19
-
20
-
21
-
22
-
23
-
24
-
25
-
26
-
27
-
28
-
29
-
30
-
31
-
32
-
33
-
34
-
35
-
36
-
37
-
38
-
39
-
40
-
41
-
42
-
43
-
44
-
45
-
 46
46 -
 47
47 -
 48
48 -
 49
49 -
 50
50 -
 51
51 -
 52
52 -
 53
53 -
 54
54 -
 55
55 -
 56
56 -
 57
57 -
 58
58 -
 59
59 -
 60
60 -
 61
61 -
 62
62 -
 63
63 -
 64
64 -
 65
65 -
 66
66 -
67
-
68
-
69
-
70
-
71
-
72
-
73
-
74
-
75
-
76
-
77
-
78
-
79
-
80
-
81
-
82
-
83
-
84
-
85
-
86
-
87
-
88
-
89
-
90
-
91
-
92
-
93
-
94
-
95
-
96
-
97
-
98
-
99
-
100
-
101
-
102
-
103
-
104
-
105
-
106
-
107
-
108
-
109
-
110
-
111
-
112
-
113
-
114
-
115
-
116
-
117
-
118
-
119
-
120
-
121
-
122
-
123
-
124
-
125
-
126
-
127
-
128
-
129
-
130
-
131
-
132
-
133
-
134
-
135
-
136
-
137
-
138
-
139
-
140
-
141
-
142
-
143
-
144
-
145
-
146
-
147
-
148
-
149
-
150
-
151
-
152
-
153
-
154
-
155
-
156
-
157
-
158
-
159
-
160
 |
 |

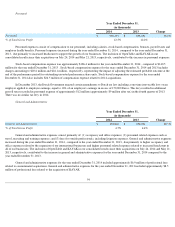
Cost of Revenues
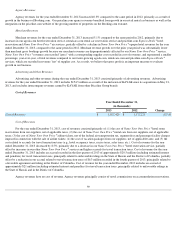
For the year ended December 31, 2014 , cost of revenues consisted primarily of: (1) the cost paid to travel service providers for
priceline.com's Name Your Own Price
®
reservation services, net of applicable taxes and charges; (2) fees paid to third parties by KAYAK and
priceline.com to return travel itinerary information in response to search queries; and (3) costs related to accruals for travel transaction taxes
(e.g., hotel occupancy taxes, excise taxes, sales taxes, etc.). Cost of revenues for the year ended December 31, 2014 decreased by 20.4% ,
compared to the year ended December 31, 2013 , primarily due to a decrease in priceline.com's Name Your Own Price
®
reservation services.
Cost of revenues for the year ended December 31, 2013 includes an accrual recorded in the first quarter of 2013 of approximately $20.5 million
(including estimated interest and penalties) for travel transaction taxes, principally related to unfavorable rulings in the State of Hawaii and the
District of Columbia, partially offset by a reduction in our accrual related to travel transaction taxes of $6.3 million
recorded in the fourth quarter
of 2013, principally related to a favorable agreement and ruling in the District of Columbia.
Agency revenues have no cost of revenue. Agency revenues principally consist of travel commissions on accommodation reservations.
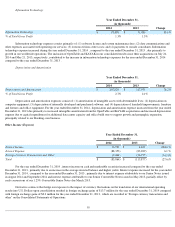
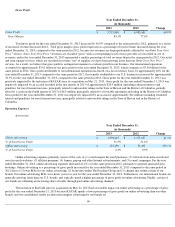
Gross Profit
Total gross profit for the year ended December 31, 2014 increased by 32.7% compared to the year ended December 31, 2013 (growth
on a local currency basis was approximately 34% ), primarily as a result of the increased revenue discussed above. Total gross margin (gross
profit expressed as a percentage of total revenue) increased during the year ended December 31, 2014 , compared to the year ended
December 31, 2013 , because our revenues are disproportionately affected by priceline.com's Name Your Own Price
®
reservation services.
Name
Your Own Price
®
revenues are recorded "gross" with a corresponding travel service provider cost recorded in cost of revenues, and in the year
ended December 31, 2014 these revenues represented a smaller percentage of total revenues than in the year ended December 31, 2013 . Our
retail and semi-opaque reservation services, which are recorded in revenue "net" of travel provider cost have been growing faster than
priceline.com's Name Your Own Price
®
reservation services. As a result, we believe that gross profit is an important measure to evaluate growth
in our business. Our international operations accounted for approximately $6.6 billion of our gross profit for the year ended December 31, 2014
,
which compares to $5.0 billion for the year ended December 31, 2013 . Gross profit attributable to our international operations increased, on a
local currency basis, by approximately 34% for the year ended December 31, 2014 compared to the year ended December 31, 2013
. Gross profit
attributable to our U.S. businesses increased by approximately 35.4% for the year ended December 31, 2014 , compared to the year ended
December 31, 2013 . Gross profit for the year ended December 31, 2014 was positively impacted by the inclusion of OpenTable and KAYAK
since their acquisitions on July 24, 2014 and May 21, 2013, respectively. Gross profit for the year ended December 31, 2013 was negatively
impacted by an accrual recorded in the first quarter of 2013 of approximately $20.5 million (including estimated interest and penalties) for travel
transaction taxes, principally related to unfavorable rulings in the State of Hawaii and the District of Columbia, partially offset by a credit in the
fourth quarter of 2013 of $6.3 million , principally related to a favorable agreement and ruling in the District of Columbia.
The U.S. Dollar is significantly stronger against the Euro and many other currencies as of January 31, 2015 compared to 2014. At these
exchange rates, the growth of our total and international gross bookings, expressed in U.S. Dollars, will be significantly adversely impacted in
2015.
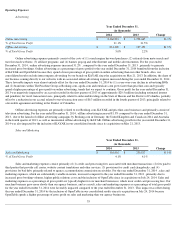
52
Year Ended December 31,
(in thousands)
2014
2013
Change
Gross Profit
$
7,584,130
$
5,715,886
32.7
%
Gross Margin
89.8
%
84.1
%