Priceline 2014 Annual Report Download - page 61
Download and view the complete annual report
Please find page 61 of the 2014 Priceline annual report below. You can navigate through the pages in the report by either clicking on the pages listed below, or by using the keyword search tool below to find specific information within the annual report.-
 1
1 -
2
-
3
-
4
-
5
-
6
-
7
-
8
-
9
-
10
-
11
-
12
-
13
-
14
-
15
-
16
-
17
-
18
-
19
-
20
-
21
-
22
-
23
-
24
-
25
-
26
-
27
-
28
-
29
-
30
-
31
-
32
-
33
-
34
-
35
-
36
-
37
-
38
-
39
-
40
-
41
-
42
-
43
-
44
-
45
-
46
-
47
-
48
-
49
-
50
-
 51
51 -
 52
52 -
 53
53 -
 54
54 -
 55
55 -
 56
56 -
 57
57 -
 58
58 -
 59
59 -
 60
60 -
 61
61 -
 62
62 -
 63
63 -
 64
64 -
 65
65 -
 66
66 -
 67
67 -
 68
68 -
 69
69 -
 70
70 -
 71
71 -
72
-
73
-
74
-
75
-
76
-
77
-
78
-
79
-
80
-
81
-
82
-
83
-
84
-
85
-
86
-
87
-
88
-
89
-
90
-
91
-
92
-
93
-
94
-
95
-
96
-
97
-
98
-
99
-
100
-
101
-
102
-
103
-
104
-
105
-
106
-
107
-
108
-
109
-
110
-
111
-
112
-
113
-
114
-
115
-
116
-
117
-
118
-
119
-
120
-
121
-
122
-
123
-
124
-
125
-
126
-
127
-
128
-
129
-
130
-
131
-
132
-
133
-
134
-
135
-
136
-
137
-
138
-
139
-
140
-
141
-
142
-
143
-
144
-
145
-
146
-
147
-
148
-
149
-
150
-
151
-
152
-
153
-
154
-
155
-
156
-
157
-
158
-
159
-
160
 |
 |

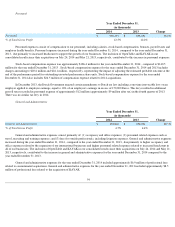
Results of Operations
Year Ended December 31, 2013 compared to Year Ended December 31, 2012
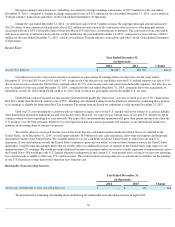
Operating and Statistical Metrics
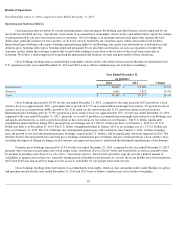
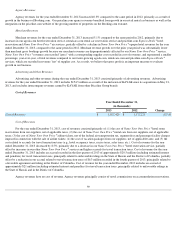
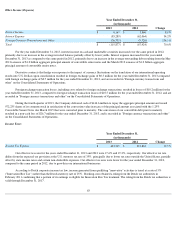
Gross bookings resulting from accommodation room nights, rental car days and airline tickets reserved through our international and
U.S. operations for the years ended December 31, 2013 and 2012 were as follows (numbers may not total due to rounding):
Gross bookings increased by 37.7% for the year ended December 31, 2013, compared to the same period in 2012 (growth on a local
currency basis was approximately 38%), principally due to growth of 36.9% in accommodation room night reservations and growth of 37.0% in
rental car day reservations. The 42.5% increase in international gross bookings (growth on a local currency basis was approximately 42%) was
primarily attributable to growth in hotel and accommodation room night reservations for our Booking.com and agoda.com businesses, as well as
growth in rental car day reservations for our rentalcars.com business. Domestic gross bookings increased by 15.5% for the year ended
December 31, 2013, compared to the same period in 2012, primarily due to an increase in priceline.com's retail airline ticket service, Express
Deals
®
hotel reservation service, and retail rental car service, partially offset by a decline in our Name Your Own Price
®
opaque hotel
reservation service (driven in part by customer shift to Express Deals
®
).
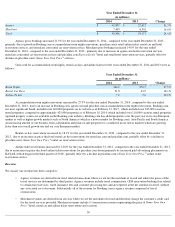
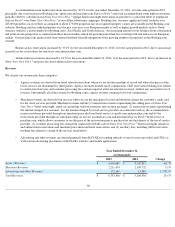
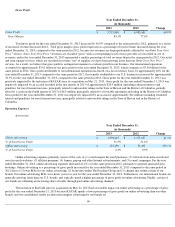
Gross bookings resulting from reservations of accommodation room nights, rental car days and airline tickets made through our agency
and merchant models for the years ended December 31, 2013 and 2012 were as follows (numbers may not total due to rounding):
Agency gross bookings increased 40.3% for the year ended December 31, 2013, primarily due to growth in Booking.com
accommodation room night reservations, as well as growth in priceline.com's retail airline ticket and rental car services. Merchant gross
bookings increased 25.7% for the year ended December 31, 2013, compared to the same period in 2012, primarily due to an increase in the sale
of agoda.com accommodation room night reservations, priceline.com Express Deals
®
hotel room night reservations, rentalcars.com rental car
day reservations and Name Your Own Price
®
airline ticket reservations, partially offset by a decline in our Name Your Own Price
®
opaque hotel
reservation service.
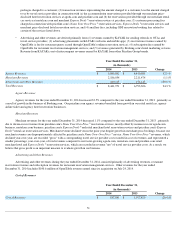
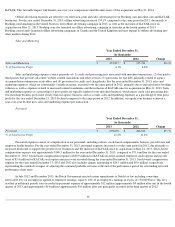
Units sold for accommodation room nights, rental car days and airline tickets for the years ended December 31, 2013 and 2012 were as
follows:
57
Year Ended December 31,
(in millions)
2013
2012
Change
International
$
33,300
$
23,370
42.5
%
Domestic
5,873
5,086
15.5
%
Total
$
39,173
$
28,456
37.7
%
Year Ended December 31,
(in millions)
2013
2012
Change
Agency
$
32,672
$
23,284
40.3
%
Merchant
6,501
5,172
25.7
%
Total
$
39,173
$
28,456
37.7
%
Year Ended December 31,
(in millions)
2013
2012
Change
Room Nights
270.5
197.5
36.9
%
Rental Car Days
43.9
32.0
37.0
%
Airline Tickets
7.0
6.4
9.1
%