Priceline 2014 Annual Report Download - page 97
Download and view the complete annual report
Please find page 97 of the 2014 Priceline annual report below. You can navigate through the pages in the report by either clicking on the pages listed below, or by using the keyword search tool below to find specific information within the annual report.-
 1
1 -
2
-
3
-
4
-
5
-
6
-
7
-
8
-
9
-
10
-
11
-
12
-
13
-
14
-
15
-
16
-
17
-
18
-
19
-
20
-
21
-
22
-
23
-
24
-
25
-
26
-
27
-
28
-
29
-
30
-
31
-
32
-
33
-
34
-
35
-
36
-
37
-
38
-
39
-
40
-
41
-
42
-
43
-
44
-
45
-
46
-
47
-
48
-
49
-
50
-
51
-
52
-
53
-
54
-
55
-
56
-
57
-
58
-
59
-
60
-
61
-
62
-
63
-
64
-
65
-
66
-
67
-
68
-
69
-
70
-
71
-
72
-
73
-
74
-
75
-
76
-
77
-
78
-
79
-
80
-
81
-
82
-
83
-
84
-
85
-
86
-
 87
87 -
 88
88 -
 89
89 -
 90
90 -
 91
91 -
 92
92 -
 93
93 -
 94
94 -
 95
95 -
 96
96 -
 97
97 -
 98
98 -
 99
99 -
 100
100 -
 101
101 -
 102
102 -
 103
103 -
 104
104 -
 105
105 -
 106
106 -
 107
107 -
108
-
109
-
110
-
111
-
112
-
113
-
114
-
115
-
116
-
117
-
118
-
119
-
120
-
121
-
122
-
123
-
124
-
125
-
126
-
127
-
128
-
129
-
130
-
131
-
132
-
133
-
134
-
135
-
136
-
137
-
138
-
139
-
140
-
141
-
142
-
143
-
144
-
145
-
146
-
147
-
148
-
149
-
150
-
151
-
152
-
153
-
154
-
155
-
156
-
157
-
158
-
159
-
160
 |
 |

2013 Performance Share Units
During the year ended December 31, 2013 , stock-based awards included grants of 104,865 performance share units with a grant date
fair value of $74.4 million , based on a weighted average grant date fair value of $709.74 per share. The actual number of shares will be
determined upon completion of the performance period which ends December 31, 2015.
At December 31, 2014 , there were 102,816 unvested 2013 performance share units outstanding, net of performance share units that
were forfeited or vested since the grant date. As of December 31, 2014 , the number of shares estimated to be issued pursuant to these
performance share units at the end of the performance period is a total of 197,225 shares. If the maximum performance thresholds are met at the
end of the performance period, a maximum of 225,202 total shares could be issued pursuant to these performance share units. If the minimum
performance thresholds are not met, 40,120 shares would be issued at the end of the performance period.
2012 Performance Share Units
During the year ended December 31, 2012 , stock-based awards included grants of 60,365
performance share units with a grant date fair
value of $39.0 million , based on a weighted average grant date fair value of $645.86 per share. The actual number of shares will be determined
after completion of the performance period which ended on December 31, 2014.
At December 31, 2014 , there were 57,571 unvested 2012
performance share units outstanding, net of performance share units that were
forfeited or vested since the grant date. As of December 31, 2014 , the total number of shares expected to be issued pursuant to these
performance shares units on the March 4, 2015 vesting date is 100,190 shares.
Stock Options - Other than Stock Options Assumed in Acquisitions
During the year ended December 31, 2014 , stock options were exercised for 7,780 shares of common stock with a weighted average
exercise price per share of $22.47 . As of December 31, 2014 , there were 1,220 shares of common stock subject to outstanding and exercisable
stock options with a weighted average exercise price per share of $23.08 , a weighted average remaining term of 0.5 years , and an aggregate
intrinsic value of $1.4 million . The intrinsic value of stock options exercised during the years ended December 31, 2014 , 2013 and 2012 was
$9.3 million , $44.9 million and $75.2 million , respectively. As of December 31, 2011, there were no outstanding and unvested stock options
originally granted by the Company. No stock options were granted by the Company during the years ended December 31, 2014 , 2013 and
2012 .
Stock Options Assumed in Acquisitions
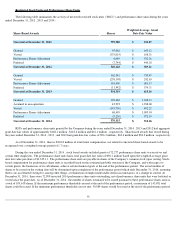
The following table summarizes for the year ended December 31, 2014 stock option activity for employee stock options assumed in
acquisitions:
92
Assumed Employee Stock Options
Number of
Shares
Weighted
Average
Exercise Price
Aggregate
Intrinsic Value
(000's)
Weighted
Average
Remaining
Contractual
Term (in years)
Balance, January 1, 2013
—
$
—
$
—
0
Assumed in acquisition
540,179
$
260.96
Exercised
(387,669
)
$
222.73
Forfeited
(23,802
)
$
478.83
Balance, December 31, 2013
128,708
$
335.83
$
106,386
6.9
Assumed in acquisitions
61,897
$
457.67
Exercised
(43,223
)
$
342.39
Forfeited
(2,217
)
$
517.91
Balance, December 31, 2014
145,165
$
383.05
$
109,914
6.5
Vested and exercisable as of December 31, 2014
88,118
$
306.32
$
73,481
5.7
Vested and exercisable as of December 31, 2014
and expected to vest thereafter, net of estimated
forfeitures
144,077
$
382.81
$
109,124
6.5