Priceline 2014 Annual Report Download - page 84
Download and view the complete annual report
Please find page 84 of the 2014 Priceline annual report below. You can navigate through the pages in the report by either clicking on the pages listed below, or by using the keyword search tool below to find specific information within the annual report.-
 1
1 -
2
-
3
-
4
-
5
-
6
-
7
-
8
-
9
-
10
-
11
-
12
-
13
-
14
-
15
-
16
-
17
-
18
-
19
-
20
-
21
-
22
-
23
-
24
-
25
-
26
-
27
-
28
-
29
-
30
-
31
-
32
-
33
-
34
-
35
-
36
-
37
-
38
-
39
-
40
-
41
-
42
-
43
-
44
-
45
-
46
-
47
-
48
-
49
-
50
-
51
-
52
-
53
-
54
-
55
-
56
-
57
-
58
-
59
-
60
-
61
-
62
-
63
-
64
-
65
-
66
-
67
-
68
-
69
-
70
-
71
-
72
-
73
-
 74
74 -
 75
75 -
 76
76 -
 77
77 -
 78
78 -
 79
79 -
 80
80 -
 81
81 -
 82
82 -
 83
83 -
 84
84 -
 85
85 -
 86
86 -
 87
87 -
 88
88 -
 89
89 -
 90
90 -
 91
91 -
 92
92 -
 93
93 -
 94
94 -
95
-
96
-
97
-
98
-
99
-
100
-
101
-
102
-
103
-
104
-
105
-
106
-
107
-
108
-
109
-
110
-
111
-
112
-
113
-
114
-
115
-
116
-
117
-
118
-
119
-
120
-
121
-
122
-
123
-
124
-
125
-
126
-
127
-
128
-
129
-
130
-
131
-
132
-
133
-
134
-
135
-
136
-
137
-
138
-
139
-
140
-
141
-
142
-
143
-
144
-
145
-
146
-
147
-
148
-
149
-
150
-
151
-
152
-
153
-
154
-
155
-
156
-
157
-
158
-
159
-
160
 |
 |
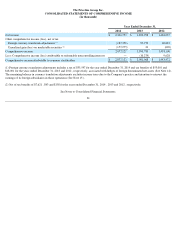
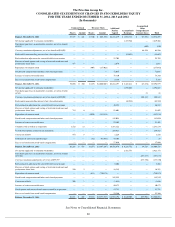
The Priceline Group Inc.
CONSOLIDATED STATEMENTS OF OPERATIONS
(In thousands, except per share data)
See Notes to Consolidated Financial Statements.
80
Year Ended December 31,
2014
2013
2012
Agency revenues
$
5,845,802
$
4,410,689
$
3,142,815
Merchant revenues
2,186,054
2,211,474
2,104,752
Advertising and other revenues
410,115
171,143
13,389
Total revenues
8,441,971
6,793,306
5,260,956
Cost of revenues
857,841
1,077,420
1,177,275
Gross profit
7,584,130
5,715,886
4,083,681
Operating expenses:
Advertising — Online
2,360,221
1,798,645
1,273,637
Advertising — Offline
231,309
127,459
35,492
Sales and marketing
310,910
235,817
195,934
Personnel, including stock-based compensation of $186,425, $140,526 and
$71,565, respectively
950,191
698,692
466,828
General and administrative
352,869
252,994
173,171
Information technology
97,498
71,890
43,685
Depreciation and amortization
207,820
117,975
65,141
Total operating expenses
4,510,818
3,303,472
2,253,888
Operating income
3,073,312
2,412,414
1,829,793
Other income (expense):
Interest income
13,933
4,167
3,860
Interest expense
(88,353
)
(83,289
)
(62,064
)
Foreign currency transactions and other
(9,444
)
(36,755
)
(9,720
)
Total other income (expense)
(83,864
)
(115,877
)
(67,924
)
Earnings before income taxes
2,989,448
2,296,537
1,761,869
Income tax expense
567,695
403,739
337,832
Net income
2,421,753
1,892,798
1,424,037
Less: net income attributable to noncontrolling interests
—
135
4,471
Net income applicable to common stockholders
$
2,421,753
$
1,892,663
$
1,419,566
Net income applicable to common stockholders per basic common share
$
46.30
$
37.17
$
28.48
Weighted average number of basic common shares outstanding
52,301
50,924
49,840
Net income applicable to common stockholders per diluted common share
$
45.67
$
36.11
$
27.66
Weighted average number of diluted common shares outstanding
53,023
52,413
51,326