Priceline 2014 Annual Report Download - page 55
Download and view the complete annual report
Please find page 55 of the 2014 Priceline annual report below. You can navigate through the pages in the report by either clicking on the pages listed below, or by using the keyword search tool below to find specific information within the annual report.-
 1
1 -
2
-
3
-
4
-
5
-
6
-
7
-
8
-
9
-
10
-
11
-
12
-
13
-
14
-
15
-
16
-
17
-
18
-
19
-
20
-
21
-
22
-
23
-
24
-
25
-
26
-
27
-
28
-
29
-
30
-
31
-
32
-
33
-
34
-
35
-
36
-
37
-
38
-
39
-
40
-
41
-
42
-
43
-
44
-
 45
45 -
 46
46 -
 47
47 -
 48
48 -
 49
49 -
 50
50 -
 51
51 -
 52
52 -
 53
53 -
 54
54 -
 55
55 -
 56
56 -
 57
57 -
 58
58 -
 59
59 -
 60
60 -
 61
61 -
 62
62 -
 63
63 -
 64
64 -
 65
65 -
66
-
67
-
68
-
69
-
70
-
71
-
72
-
73
-
74
-
75
-
76
-
77
-
78
-
79
-
80
-
81
-
82
-
83
-
84
-
85
-
86
-
87
-
88
-
89
-
90
-
91
-
92
-
93
-
94
-
95
-
96
-
97
-
98
-
99
-
100
-
101
-
102
-
103
-
104
-
105
-
106
-
107
-
108
-
109
-
110
-
111
-
112
-
113
-
114
-
115
-
116
-
117
-
118
-
119
-
120
-
121
-
122
-
123
-
124
-
125
-
126
-
127
-
128
-
129
-
130
-
131
-
132
-
133
-
134
-
135
-
136
-
137
-
138
-
139
-
140
-
141
-
142
-
143
-
144
-
145
-
146
-
147
-
148
-
149
-
150
-
151
-
152
-
153
-
154
-
155
-
156
-
157
-
158
-
159
-
160
 |
 |

packages charged to a customer; (2) transaction revenues representing the amount charged to a customer, less the amount charged
to us by travel service providers in connection with (a) the accommodation reservations provided through our merchant price-
disclosed hotel reservation services at agoda.com and priceline.com and (b) the reservations provided through our merchant rental
car service at rentalcars.com and merchant Express Deals
®
reservation services at priceline.com; (3) customer processing fees
charged in connection with priceline.com's Name Your Own Price
®
reservation services, Express Deals
®
reservation services and
merchant price-disclosed hotel reservation services; and (4) ancillary fees, including GDS reservation booking fees related to
certain of the services listed above.
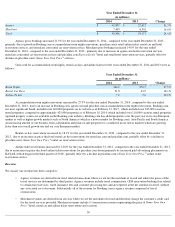
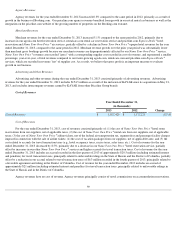
Agency Revenues
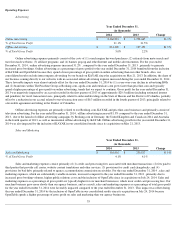
Agency revenues for the year ended December 31, 2014 increased 32.5% compared to the year ended December 31, 2013
, primarily as
a result of growth in the business of Booking.com. Our priceline.com agency revenues benefited from growth in our retail rental car, agency
airline ticket and agency hotel reservation businesses.
Merchant Revenues
Merchant revenues for the year ended December 31, 2014 decreased 1.1% compared to the year ended December 31, 2013 , primarily
due to decreases in revenues from priceline.com's Name Your Own Price
®
reservation services, mostly offset by increases in our agoda.com
business, rentalcars.com business, priceline.com's Express Deals
®
and retail merchant hotel reservation services and priceline.com's Express
Deals
®
rental car reservation services. Merchant revenue declined versus the prior year despite growth in merchant gross bookings, because our
merchant revenues are disproportionately affected by priceline.com's Name Your Own Price
®
service. Name Your Own Price
®
revenues, which
declined year-over-year, are recorded "gross" with a corresponding travel service provider cost recorded in cost of revenues, and represented a
smaller percentage, year-over-year, of total revenues compared to our faster-growing agoda.com, rentalcars.com and priceline.com retail
merchant hotel and Express Deals
®
reservation services, which are recorded in revenue "net" of travel service provider costs. As a result, we
believe that gross profit is an important measure to evaluate growth in our business.
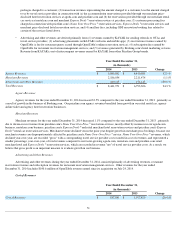
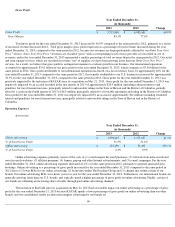
Advertising and Other Revenues
Advertising and other revenues during the year ended December 31, 2014 consisted primarily of advertising revenues, restaurant
reservation revenues and subscription revenues for restaurant reservation management services. Other revenues for the year ended
December 31, 2014 includes $100.6 million of OpenTable revenue earned since its acquisition on July 24, 2014.
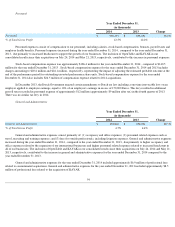
Cost of Revenues
51
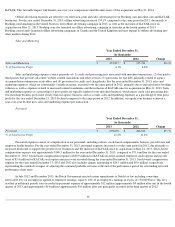
• Advertising and other revenues are derived primarily from (1) revenues earned by KAYAK for sending referrals to OTAs and
travel service providers; (2) advertising placements on KAYAK's websites and mobile apps; (3) reservation revenues earned by
OpenTable (a fee for restaurant guests seated through OpenTable's online reservation service); (4) subscription fees earned by
OpenTable for restaurant reservation management services; and (5) revenues generated by Booking.com's hotel marketing services.
Revenue from KAYAK is net of intercompany revenues earned by KAYAK from other Priceline Group brands.
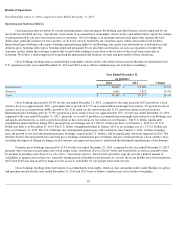
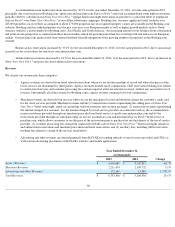
Year Ended December 31,
(in thousands)
2014
2013
Change
Agency Revenues
$
5,845,802
$
4,410,689
32.5
%
Merchant Revenues
2,186,054
2,211,474
(1.1
)%
Advertising and Other Revenues
410,115
171,143
139.6
%
Total Revenues
$
8,441,971
$
6,793,306
24.3
%
Year Ended December 31,
(in thousands)
2014
2013
Change
Cost of Revenues
$
857,841
$
1,077,420
(20.4
)%