Priceline 2014 Annual Report Download - page 57
Download and view the complete annual report
Please find page 57 of the 2014 Priceline annual report below. You can navigate through the pages in the report by either clicking on the pages listed below, or by using the keyword search tool below to find specific information within the annual report.-
 1
1 -
2
-
3
-
4
-
5
-
6
-
7
-
8
-
9
-
10
-
11
-
12
-
13
-
14
-
15
-
16
-
17
-
18
-
19
-
20
-
21
-
22
-
23
-
24
-
25
-
26
-
27
-
28
-
29
-
30
-
31
-
32
-
33
-
34
-
35
-
36
-
37
-
38
-
39
-
40
-
41
-
42
-
43
-
44
-
45
-
46
-
 47
47 -
 48
48 -
 49
49 -
 50
50 -
 51
51 -
 52
52 -
 53
53 -
 54
54 -
 55
55 -
 56
56 -
 57
57 -
 58
58 -
 59
59 -
 60
60 -
 61
61 -
 62
62 -
 63
63 -
 64
64 -
 65
65 -
 66
66 -
 67
67 -
68
-
69
-
70
-
71
-
72
-
73
-
74
-
75
-
76
-
77
-
78
-
79
-
80
-
81
-
82
-
83
-
84
-
85
-
86
-
87
-
88
-
89
-
90
-
91
-
92
-
93
-
94
-
95
-
96
-
97
-
98
-
99
-
100
-
101
-
102
-
103
-
104
-
105
-
106
-
107
-
108
-
109
-
110
-
111
-
112
-
113
-
114
-
115
-
116
-
117
-
118
-
119
-
120
-
121
-
122
-
123
-
124
-
125
-
126
-
127
-
128
-
129
-
130
-
131
-
132
-
133
-
134
-
135
-
136
-
137
-
138
-
139
-
140
-
141
-
142
-
143
-
144
-
145
-
146
-
147
-
148
-
149
-
150
-
151
-
152
-
153
-
154
-
155
-
156
-
157
-
158
-
159
-
160
 |
 |

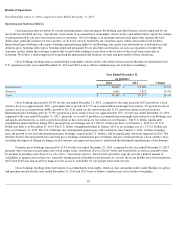
Operating Expenses
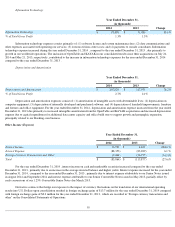
Advertising
Online advertising expenses primarily consist of the costs of (1) search engine keyword purchases; (2) referrals from meta-search and
travel research websites; (3) affiliate programs; and (4) banner, pop-up and other Internet and mobile advertisements. For the year ended
December 31, 2014 , online advertising expenses increased 31.2% , compared to the year ended December 31, 2013 , primarily to generate
increased gross bookings. Online advertising as a percentage of gross profit for the year ended December 31, 2014 benefited from the inclusion
of KAYAK and OpenTable because they spend a lower percentage of gross profit on online advertising than our other brands. Also, our
consolidated results exclude intercompany advertising by our brands on KAYAK since the acquisition on May 21, 2013. In addition, the share of
our business coming directly to our websites with no associated online advertising expense increased during the year ended December 31, 2014
.
These favorable impacts were almost entirely offset for the year ended December 31, 2014 by (1) a year-over-year decline in advertising ROIs
and (2) brand mix within The Priceline Group as Booking.com, agoda.com and rentalcars.com grew faster than priceline.com and typically
spend a higher percentage of gross profit on online advertising, trends that we expect to continue. Gross profit for the year ended December 31,
2013 was negatively impacted by an accrual recorded in the first quarter of 2013 of approximately $20.5 million (including estimated interest
and penalties) for travel transaction taxes, principally related to unfavorable rulings in the State of Hawaii and the District of Columbia, partially
offset by a reduction in our accrual related to travel transaction taxes of $6.3 million recorded in the fourth quarter of 2013, principally related to
a favorable agreement and ruling in the District of Columbia.
Offline advertising expenses are primarily related to our Booking.com, KAYAK and priceline.com businesses and primarily consist of
television advertising. For the year ended December 31, 2014 , offline advertising increased 81.5% compared to the year ended December 31,
2013 , due to the launch of offline advertising campaigns by Booking.com in Germany, the United Kingdom and Canada in 2014 and Australia
in the fourth quarter of 2013, as well as incremental offline advertising by KAYAK. Offline advertising growth for the year ended
December 31,
2014 was also impacted by the inclusion of KAYAK in our consolidated results since its acquisition on May 21, 2013.
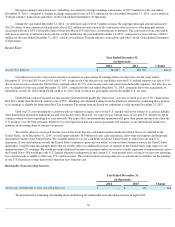
Sales and Marketing
Sales and marketing expenses consist primarily of (1) credit card processing fees associated with merchant transactions; (2) fees paid to
third parties that provide call center, website content translations and other services; (3) provisions for credit card chargebacks; and (4)
provisions for bad debt, primarily related to agency accommodation commission receivables. For the year ended December 31, 2014 , sales and
marketing expenses, which are substantially variable in nature, increased compared to the year ended December 31, 2013 , primarily due to
increased gross booking volumes, higher public relations costs and the inclusion of OpenTable since its acquisition on July 24, 2014. Sales and
marketing expenses as a percentage of gross profit are typically higher for our merchant businesses, which incur credit card processing fees. Our
merchant business grew more slowly than our agency business, and as a result, sales and marketing expenses as a percentage of total gross profit
for the year ended December 31, 2014 were favorably impacted compared to the year ended December 31, 2013 . This impact was offset during
the year ended December 31, 2014 by the inclusion of OpenTable in our consolidated results since its acquisition on July 24, 2014 because
OpenTable spends a higher percentage of gross profit on sales and marketing than our agency businesses.
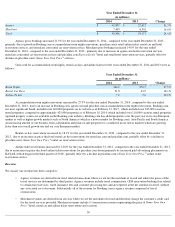
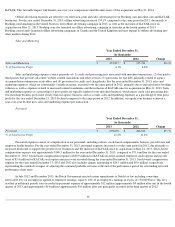
53
Year Ended December 31,
(in thousands)
2014
2013
Change
Online Advertising
$
2,360,221
$
1,798,645
31.2
%
% of Total Gross Profit
31.1
%
31.5
%
Offline Advertising
$
231,309
$
127,459
81.5
%
% of Total Gross Profit
3.0
%
2.2
%
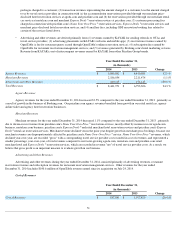
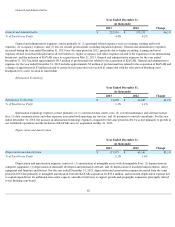
Year Ended December 31,
(in thousands)
2014
2013
Change
Sales and Marketing
$
310,910
$
235,817
31.8
%
% of Total Gross Profit
4.1
%
4.1
%