Priceline 2014 Annual Report Download - page 63
Download and view the complete annual report
Please find page 63 of the 2014 Priceline annual report below. You can navigate through the pages in the report by either clicking on the pages listed below, or by using the keyword search tool below to find specific information within the annual report.-
 1
1 -
2
-
3
-
4
-
5
-
6
-
7
-
8
-
9
-
10
-
11
-
12
-
13
-
14
-
15
-
16
-
17
-
18
-
19
-
20
-
21
-
22
-
23
-
24
-
25
-
26
-
27
-
28
-
29
-
30
-
31
-
32
-
33
-
34
-
35
-
36
-
37
-
38
-
39
-
40
-
41
-
42
-
43
-
44
-
45
-
46
-
47
-
48
-
49
-
50
-
51
-
52
-
 53
53 -
 54
54 -
 55
55 -
 56
56 -
 57
57 -
 58
58 -
 59
59 -
 60
60 -
 61
61 -
 62
62 -
 63
63 -
 64
64 -
 65
65 -
 66
66 -
 67
67 -
 68
68 -
 69
69 -
 70
70 -
 71
71 -
 72
72 -
 73
73 -
74
-
75
-
76
-
77
-
78
-
79
-
80
-
81
-
82
-
83
-
84
-
85
-
86
-
87
-
88
-
89
-
90
-
91
-
92
-
93
-
94
-
95
-
96
-
97
-
98
-
99
-
100
-
101
-
102
-
103
-
104
-
105
-
106
-
107
-
108
-
109
-
110
-
111
-
112
-
113
-
114
-
115
-
116
-
117
-
118
-
119
-
120
-
121
-
122
-
123
-
124
-
125
-
126
-
127
-
128
-
129
-
130
-
131
-
132
-
133
-
134
-
135
-
136
-
137
-
138
-
139
-
140
-
141
-
142
-
143
-
144
-
145
-
146
-
147
-
148
-
149
-
150
-
151
-
152
-
153
-
154
-
155
-
156
-
157
-
158
-
159
-
160
 |
 |

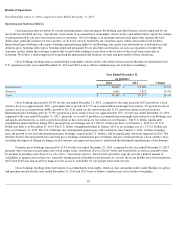
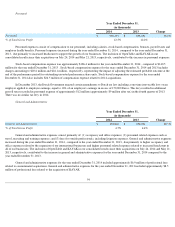
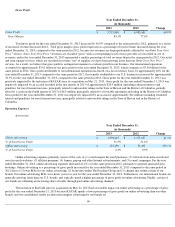
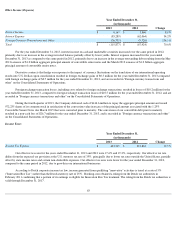
Agency Revenues
Agency revenues for the year ended December 31, 2013 increased 40.3% compared to the same period in 2012, primarily as a result of
growth in the business of Booking.com. Our priceline.com agency revenues benefited from growth in our retail rental car business as well as the
integration on the priceline.com website of the growing number of properties on the Booking.com extranet.
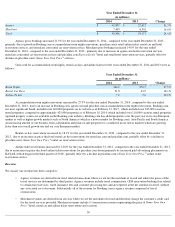
Merchant Revenues
Merchant revenues for the year ended December 31, 2013 increased 5.1% compared to the same period in 2012, primarily due to
increases in our agoda.com hotel reservation service, rentalcars.com rental car reservation service and priceline.com Express Deals
®
hotel
reservation and Name Your Own Price
®
air services, partially offset by a decline in Name Your Own Price
®
opaque hotel revenues for the year
ended December 31, 2013, compared to the same period in 2012. Merchant revenue growth over the prior year period was substantially lower
than merchant gross bookings growth because our merchant revenues are disproportionately affected by our Name Your Own Price
®
service.
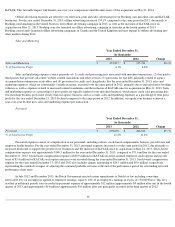
Name Your Own Price
®
revenues are recorded "gross" with a corresponding supplier cost recorded in cost of revenues, and represented a smaller
percentage, year-over-year, of total revenues compared to our faster-growing agoda.com, rentalcars.com and priceline.com Express Deals
®
services, which are recorded in revenue "net" of supplier cost. As a result, we believe that gross profit is an important measure to evaluate
growth in our business.
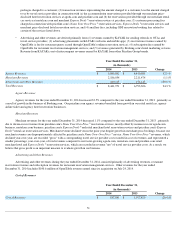
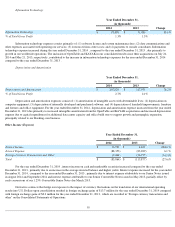
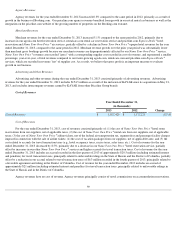
Advertising and Other Revenues
Advertising and other revenues during the year ended December 31, 2013 consisted primarily of advertising revenues. Advertising
revenues for the year ended December 31, 2013 includes $154.5 million as a result of the inclusion of KAYAK since its acquisition on May 21,
2013, and excludes intercompany revenues earned by KAYAK from other Priceline Group brands.
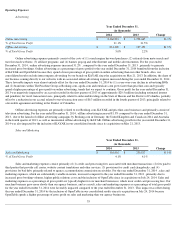
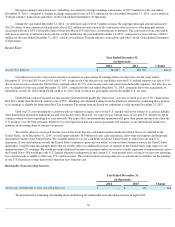
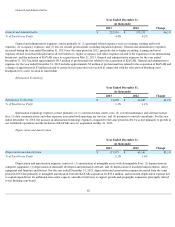
Cost of Revenues
Cost of Revenues
For the year ended December 31, 2013, cost of revenues consisted primarily of: (1) the cost of Name Your Own Price
®
hotel room
reservations from our suppliers, net of applicable taxes, (2) the cost of Name Your Own Price
®
rental cars from our suppliers, net of applicable
taxes; (3) the cost of Name Your Own Price
®
airline tickets, net of the federal air transportation tax, segment fees and passenger facility charges
imposed in connection with the sale of airline tickets; (4) the cost of vacation packages from our suppliers, net of applicable taxes; and (5) the
cost related to accruals for travel transaction taxes (e.g., hotel occupancy taxes, excise taxes, sales taxes, etc.). Cost of revenues for the year
ended December 31, 2013 decreased by 8.5%, primarily due to a decrease in our Name Your Own Price
®
hotel reservation service, partially
offset by increases in our other Name Your Own Price
®
services and higher accruals for travel transaction taxes. Cost of revenues for the year
ended December 31, 2013 includes an accrual recorded in the first quarter of 2013 of approximately $20.5 million (including estimated interest
and penalties) for travel transaction taxes, principally related to unfavorable rulings in the State of Hawaii and the District of Columbia, partially
offset by a reduction in our accrual related to travel transaction taxes of $6.3 million recorded in the fourth quarter of 2013, principally related to
a favorable agreement and ruling in the District of Columbia. Cost of revenue for the year ended December, 2012 includes an accrual of
approximately $21 million (including estimated interest and penalties) for travel transaction taxes, principally related to unfavorable rulings in
the State of Hawaii and in the District of Columbia.
Agency revenues have no cost of revenue. Agency revenues principally consist of travel commissions on accommodation reservations.
59
Year Ended December 31,
(in thousands)
2013
2012
Change
Cost of Revenues
$
1,077,420
$
1,177,275
(8.5
)%