Priceline 2014 Annual Report Download - page 65
Download and view the complete annual report
Please find page 65 of the 2014 Priceline annual report below. You can navigate through the pages in the report by either clicking on the pages listed below, or by using the keyword search tool below to find specific information within the annual report.-
 1
1 -
2
-
3
-
4
-
5
-
6
-
7
-
8
-
9
-
10
-
11
-
12
-
13
-
14
-
15
-
16
-
17
-
18
-
19
-
20
-
21
-
22
-
23
-
24
-
25
-
26
-
27
-
28
-
29
-
30
-
31
-
32
-
33
-
34
-
35
-
36
-
37
-
38
-
39
-
40
-
41
-
42
-
43
-
44
-
45
-
46
-
47
-
48
-
49
-
50
-
51
-
52
-
53
-
54
-
 55
55 -
 56
56 -
 57
57 -
 58
58 -
 59
59 -
 60
60 -
 61
61 -
 62
62 -
 63
63 -
 64
64 -
 65
65 -
 66
66 -
 67
67 -
 68
68 -
 69
69 -
 70
70 -
 71
71 -
 72
72 -
 73
73 -
 74
74 -
 75
75 -
76
-
77
-
78
-
79
-
80
-
81
-
82
-
83
-
84
-
85
-
86
-
87
-
88
-
89
-
90
-
91
-
92
-
93
-
94
-
95
-
96
-
97
-
98
-
99
-
100
-
101
-
102
-
103
-
104
-
105
-
106
-
107
-
108
-
109
-
110
-
111
-
112
-
113
-
114
-
115
-
116
-
117
-
118
-
119
-
120
-
121
-
122
-
123
-
124
-
125
-
126
-
127
-
128
-
129
-
130
-
131
-
132
-
133
-
134
-
135
-
136
-
137
-
138
-
139
-
140
-
141
-
142
-
143
-
144
-
145
-
146
-
147
-
148
-
149
-
150
-
151
-
152
-
153
-
154
-
155
-
156
-
157
-
158
-
159
-
160
 |
 |

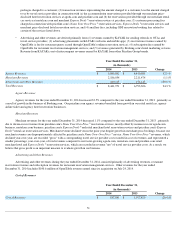
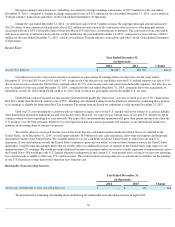
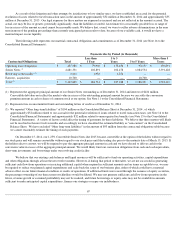
KAYAK. This favorable impact will benefit year-over-year comparisons until the anniversary of the acquisition on May 21, 2014.
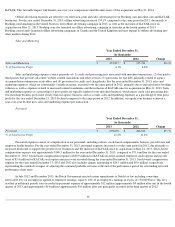
Offline advertising expenses are related to our television, print and radio advertising for our Booking.com, priceline.com and KAYAK
businesses. For the year ended December 31, 2013, offline advertising increased 259.1% compared to the same period in 2012, due mainly to
Booking.com launching in the United States its first offline advertising campaign in 2013, as well as the inclusion of KAYAK since its
acquisition on May 21, 2013. Booking.com also launched an offline advertising campaign in Australia in the fourth quarter of 2013.
Booking.com recently launched offline advertising campaigns in Canada and the United Kingdom and may expand its offline advertising into
other markets during 2014.
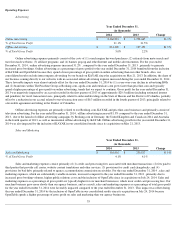
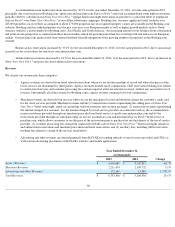
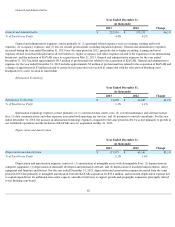
Sales and Marketing
Sales and marketing expenses consist primarily of (1) credit card processing fees associated with merchant transactions; (2) fees paid to
third-parties that provide call center, website content translations and other services; (3) provisions for bad debt, primarily related to agency
accommodation commission receivables; and (4) provisions for credit card chargebacks. For the year ended December 31, 2013, sales and
marketing expenses, which are substantially variable in nature, increased over the same period in 2012, primarily due to increased gross booking
volumes as well as expenses related to increased content translations and the inclusion of KAYAK since its acquisition on May 21, 2013. Sales
and marketing expenses as a percentage of gross profit are typically higher for our merchant business, which incurs credit card processing fees.
Our merchant business grew more slowly than our agency business, and as a result, sales and marketing expenses as a percentage of total gross
profit for the year ended December 31, 2013 declined compared to the same period in 2012. In addition, our agoda.com business achieved a
year
-over-year decline in its sales and marketing expense per transaction.
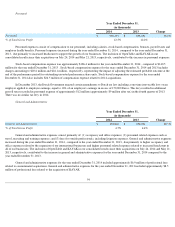
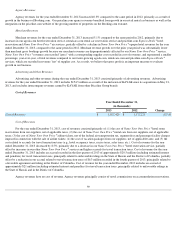
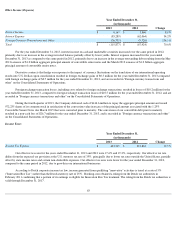
Personnel
Personnel expenses consist of compensation to our personnel, including salaries, stock-based compensation, bonuses, payroll taxes and
employee health benefits. For the year ended December 31, 2013, personnel expenses increased over the same period in 2012, due primarily to
increased headcount to support the growth of our businesses and the inclusion of KAYAK since its acquisition on May 21, 2013. Stock-based
compensation expense was approximately $140.5 million for the year ended December 31, 2013, compared to $71.6 million for the year ended
December 31, 2012. Stock-based compensation expense of $30.9 million for KAYAK unvested assumed employee stock options and payroll
taxes of $3.4 million for KAYAK stock option exercises were recorded during the year ended December 31, 2013. Stock-based compensation
expense for the years ended December 31, 2013 and 2012 also includes charges amounting to $24.1 million and $0.9 million, respectively,
representing the cumulative impact of adjusting the estimated probable outcome at the end of the performance period for outstanding unvested
performance share units.
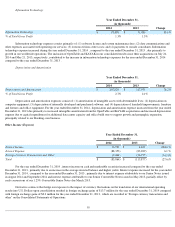
In July 2012 and December 2013, the Dutch Government enacted certain amendments to Dutch tax law including a one-time
irrevocable levy on an employer applied to employee earnings, equal to 16% of an employee's earnings in excess of 150,000 Euros. This levy
resulted in additional payroll taxes recorded in personnel expense of approximately $12 million (approximately $9 million after tax) in the fourth
quarter of 2013 and approximately $14 million (approximately $10 million after tax) principally recorded in the third quarter of 2012.
61
Year Ended December 31,
(in thousands)
2013
2012
Change
Sales and Marketing
$
235,817
$
195,934
20.4
%
% of Total Gross Profit
4.1
%
4.8
%
Year Ended December 31,
(in thousands)
2013
2012
Change
Personnel
$
698,692
$
466,828
49.7
%
% of Total Gross Profit
12.2
%
11.4
%