Pottery Barn 2008 Annual Report Download - page 78
Download and view the complete annual report
Please find page 78 of the 2008 Pottery Barn annual report below. You can navigate through the pages in the report by either clicking on the pages listed below, or by using the keyword search tool below to find specific information within the annual report.-
 1
1 -
2
-
3
-
4
-
5
-
6
-
7
-
8
-
9
-
10
-
11
-
12
-
13
-
14
-
15
-
16
-
17
-
18
-
19
-
20
-
21
-
22
-
23
-
24
-
25
-
26
-
27
-
28
-
29
-
30
-
31
-
32
-
33
-
34
-
35
-
36
-
37
-
38
-
39
-
40
-
41
-
42
-
43
-
44
-
45
-
46
-
47
-
48
-
49
-
50
-
51
-
52
-
53
-
54
-
55
-
56
-
57
-
58
-
59
-
60
-
61
-
62
-
63
-
64
-
65
-
66
-
67
-
 68
68 -
 69
69 -
 70
70 -
 71
71 -
 72
72 -
 73
73 -
 74
74 -
 75
75 -
 76
76 -
 77
77 -
 78
78 -
 79
79 -
 80
80 -
 81
81 -
 82
82 -
 83
83 -
 84
84 -
 85
85 -
 86
86 -
 87
87 -
 88
88 -
89
-
90
-
91
-
92
-
93
-
94
-
95
-
96
-
97
-
98
-
99
-
100
-
101
-
102
-
103
-
104
-
105
-
106
-
107
-
108
-
109
-
110
-
111
-
112
-
113
-
114
-
115
-
116
-
117
-
118
-
119
-
120
-
121
-
122
-
123
-
124
-
125
-
126
-
127
-
128
-
129
-
130
-
131
-
132
-
133
-
134
-
135
-
136
-
137
-
138
-
139
-
140
-
141
-
142
-
143
-
144
-
145
-
146
-
147
-
148
-
149
-
150
-
151
-
152
-
153
-
154
-
155
-
156
-
157
-
158
-
159
-
160
-
161
-
162
-
163
-
164
-
165
-
166
-
167
-
168
 |
 |

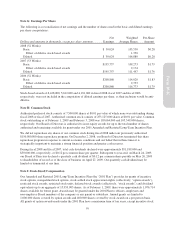
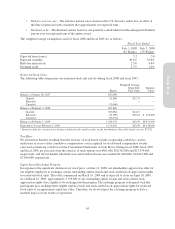
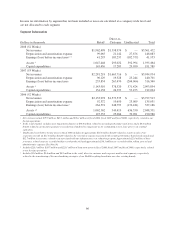
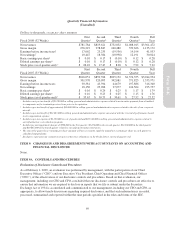
Income tax information by segment has not been included as taxes are calculated at a company-wide level and
are not allocated to each segment.
Segment Information
Dollars in thousands Retail1
Direct-to-
Customer Unallocated Total
2008 (52 Weeks)
Net revenues $1,962,498 $1,398,974 $ — $3,361,472
Depreciation and amortization expense 99,065 21,142 27,876 148,083
Earnings (loss) before income taxes2, 3 41,293 183,237 (182,577) 41,953
Assets 41,047,448 295,022 592,994 1,935,464
Capital expenditures 145,456 17,283 29,050 191,789
2007 (53 Weeks)
Net revenues $2,281,218 $1,663,716 $ — $3,944,934
Depreciation and amortization expense 96,129 19,328 25,244 140,701
Earnings (loss) before income taxes 253,834 267,470 (204,964) 316,340
Assets 41,143,910 378,520 571,424 2,093,854
Capital expenditures 134,158 24,393 53,473 212,024
2006 (52 Weeks)
Net revenues $2,153,978 $1,573,535 $ — $3,727,513
Depreciation and amortization expense 92,372 19,650 23,009 135,031
Earnings (loss) before income taxes3264,574 248,793 (176,181) 337,186
Assets 4,5 1,062,362 349,419 636,550 2,048,331
Capital expenditures 125,333 25,686 39,961 190,980
1Net revenues include $79.9 million, $87.3 million and $78.1 million in fiscal 2008, fiscal 2007 and fiscal 2006, respectively, related to our
foreign operations.
2In the retail channel, includes asset impairment charges of $34.0 million related to our underperforming retail stores and a $9.4 million
benefit related to an incentive payment received from a landlord to compensate us for terminating a store lease prior to its original
expiration.
3Unallocated costs before income taxes in fiscal 2008 includes an approximate $16.0 million benefit related to a gain on sale of our
corporate aircraft, an $11.0 million benefit related to the reversal of expense associated with certain performance-based stock awards and
$12.7 million in severance related costs associated with our infrastructure cost reduction program. Approximately $2.4 million of these
severance related costs are recorded within cost of goods sold and approximately $10.3 million are recorded within selling, general and
administrative expenses (See Note N).
4Includes $28.3 million, $30.7 million and $23.1 million of long-term assets in fiscal 2008, fiscal 2007 and fiscal 2006, respectively, related
to our foreign operations.
5Includes $2.4 million, $1.6 million and $0.3 million in the retail, direct-to-customer and corporate unallocated segments, respectively,
related to the transitioning of the merchandising strategies of our Hold Everything brand into our other existing brands.
66