Pottery Barn 2008 Annual Report Download - page 73
Download and view the complete annual report
Please find page 73 of the 2008 Pottery Barn annual report below. You can navigate through the pages in the report by either clicking on the pages listed below, or by using the keyword search tool below to find specific information within the annual report.-
 1
1 -
2
-
3
-
4
-
5
-
6
-
7
-
8
-
9
-
10
-
11
-
12
-
13
-
14
-
15
-
16
-
17
-
18
-
19
-
20
-
21
-
22
-
23
-
24
-
25
-
26
-
27
-
28
-
29
-
30
-
31
-
32
-
33
-
34
-
35
-
36
-
37
-
38
-
39
-
40
-
41
-
42
-
43
-
44
-
45
-
46
-
47
-
48
-
49
-
50
-
51
-
52
-
53
-
54
-
55
-
56
-
57
-
58
-
59
-
60
-
61
-
62
-
 63
63 -
 64
64 -
 65
65 -
 66
66 -
 67
67 -
 68
68 -
 69
69 -
 70
70 -
 71
71 -
 72
72 -
 73
73 -
 74
74 -
 75
75 -
 76
76 -
 77
77 -
 78
78 -
 79
79 -
 80
80 -
 81
81 -
 82
82 -
 83
83 -
84
-
85
-
86
-
87
-
88
-
89
-
90
-
91
-
92
-
93
-
94
-
95
-
96
-
97
-
98
-
99
-
100
-
101
-
102
-
103
-
104
-
105
-
106
-
107
-
108
-
109
-
110
-
111
-
112
-
113
-
114
-
115
-
116
-
117
-
118
-
119
-
120
-
121
-
122
-
123
-
124
-
125
-
126
-
127
-
128
-
129
-
130
-
131
-
132
-
133
-
134
-
135
-
136
-
137
-
138
-
139
-
140
-
141
-
142
-
143
-
144
-
145
-
146
-
147
-
148
-
149
-
150
-
151
-
152
-
153
-
154
-
155
-
156
-
157
-
158
-
159
-
160
-
161
-
162
-
163
-
164
-
165
-
166
-
167
-
168
 |
 |

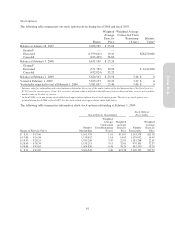
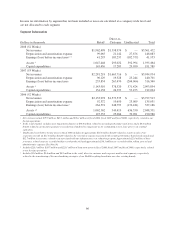
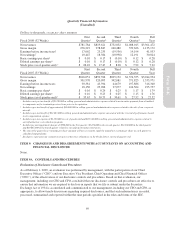
Stock Options
The following table summarizes our stock option activity during fiscal 2008 and fiscal 2007:
Shares
Weighted
Average
Exercise
Price
Weighted Average
Contractual Term
Remaining
(Years)
Intrinsic
Value1
Balance at January 28, 2007 9,026,289 $ 23.04
Granted2——
Exercised (1,979,641) 19.45 $28,470,000
Canceled (415,499) 36.60
Balance at February 3, 2008 6,631,149 $ 23.26
Granted2——
Exercised (571,782) 10.96 $ 6,219,000
Canceled (432,824) 35.29
Balance at February 1, 2009 5,626,543 $ 23.58 3.48 $ 0
Vested at February 1, 2009 5,109,153 22.22 3.22 $ 0
Vested plus expected to vest at February 1, 2009 5,581,057 23.46 3.46 $ 0
1Intrinsic value for outstanding and vested options is defined as the excess of the market value on the last business day of the fiscal year (or
$7.92) over the exercise price, if any. For exercises, intrinsic value is defined as the difference between the grant date exercise price and the
market value on the date of exercise.
2In fiscal 2006, we began issuing stock-settled stock appreciation rights in lieu of stock option grants. Therefore, no stock options were
granted during fiscal 2008 or fiscal 2007. See the stock-settled stock appreciation rights table below.
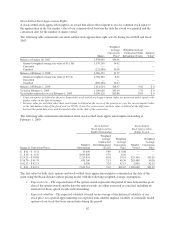
The following table summarizes information about stock options outstanding at February 1, 2009:
Stock Options Outstanding
Stock Options
Exercisable
Range of Exercise Prices
Number
Outstanding
Weighted
Average
Contractual
Term Remaining
(Years)
Weighted
Average
Exercise
Price
Number
Exercisable
Weighted
Average
Exercise
Price
$ 8.31 – $ 13.66 1,163,578 1.61 $11.03 1,163,578 $11.03
$ 13.85 – $ 16.34 1,139,652 1.14 14.65 1,139,652 14.65
$ 16.53 – $ 28.25 1,183,268 3.47 22.61 1,183,268 22.61
$ 28.45 – $ 38.34 1,135,215 5.13 32.61 970,105 32.57
$ 38.84 – $ 43.85 1,004,830 6.44 39.20 652,550 39.26
$ 8.31 – $ 43.85 5,626,543 3.48 $23.58 5,109,153 $22.22
61
Form 10-K