Pottery Barn 2008 Annual Report Download - page 44
Download and view the complete annual report
Please find page 44 of the 2008 Pottery Barn annual report below. You can navigate through the pages in the report by either clicking on the pages listed below, or by using the keyword search tool below to find specific information within the annual report.-
 1
1 -
2
-
3
-
4
-
5
-
6
-
7
-
8
-
9
-
10
-
11
-
12
-
13
-
14
-
15
-
16
-
17
-
18
-
19
-
20
-
21
-
22
-
23
-
24
-
25
-
26
-
27
-
28
-
29
-
30
-
31
-
32
-
33
-
 34
34 -
 35
35 -
 36
36 -
 37
37 -
 38
38 -
 39
39 -
 40
40 -
 41
41 -
 42
42 -
 43
43 -
 44
44 -
 45
45 -
 46
46 -
 47
47 -
 48
48 -
 49
49 -
 50
50 -
 51
51 -
 52
52 -
 53
53 -
 54
54 -
55
-
56
-
57
-
58
-
59
-
60
-
61
-
62
-
63
-
64
-
65
-
66
-
67
-
68
-
69
-
70
-
71
-
72
-
73
-
74
-
75
-
76
-
77
-
78
-
79
-
80
-
81
-
82
-
83
-
84
-
85
-
86
-
87
-
88
-
89
-
90
-
91
-
92
-
93
-
94
-
95
-
96
-
97
-
98
-
99
-
100
-
101
-
102
-
103
-
104
-
105
-
106
-
107
-
108
-
109
-
110
-
111
-
112
-
113
-
114
-
115
-
116
-
117
-
118
-
119
-
120
-
121
-
122
-
123
-
124
-
125
-
126
-
127
-
128
-
129
-
130
-
131
-
132
-
133
-
134
-
135
-
136
-
137
-
138
-
139
-
140
-
141
-
142
-
143
-
144
-
145
-
146
-
147
-
148
-
149
-
150
-
151
-
152
-
153
-
154
-
155
-
156
-
157
-
158
-
159
-
160
-
161
-
162
-
163
-
164
-
165
-
166
-
167
-
168
 |
 |
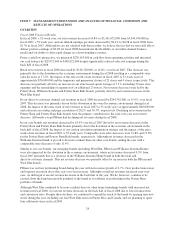
$8,600,000 net benefit recorded in fiscal 2006 that did not recur in fiscal 2007, from “Unusual Business Events”
(unredeemed gift certificate income due to a change in estimate and the Visa/MasterCard litigation settlement
income, partially offset by the expense associated with the departure of our Chief Executive Officer and the
expense associated with the Hold Everything transition).
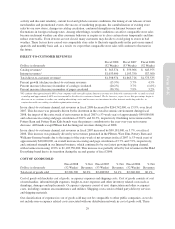
In the retail channel, selling, general and administrative expenses as a percentage of retail net revenues decreased
approximately 30 basis points in fiscal 2007 versus fiscal 2006. This decrease as a percentage of net revenues
was primarily driven by retail asset impairment charges recorded in fiscal 2006 that did not recur in fiscal 2007
and increased income from unredeemed gift certificates and gift cards, partially offset by increased employment
costs primarily associated with the growth of the emerging brands.
In the direct-to-customer channel, selling, general and administrative expenses as a percentage of
direct-to-customer net revenues decreased by approximately 60 basis points in fiscal 2007 compared to fiscal
2006. This was primarily driven by lower advertising costs due to a higher percentage of direct-to-customer
revenues being generated in the Internet channel, which operates at a lower advertising cost than the catalog, a
reduction in other general expenses and increased income from unredeemed gift certificates.
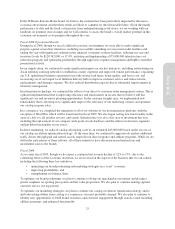
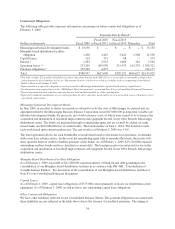
INTEREST INCOME AND EXPENSE
Interest income was $1,280,000, $5,041,000 and $11,810,000 in fiscal 2008, fiscal 2007 and fiscal 2006,
respectively, comprised primarily of income from short-term investments classified as cash and cash equivalents.
The decrease in interest income resulted from a decrease in our average investment balances and lower average
interest rates during fiscal 2008 compared to fiscal 2007. The decrease in interest income during fiscal 2007
resulted from a decrease in our average cash balances during fiscal 2007 compared to fiscal 2006.
Interest expense was $1,480,000 (net of capitalized interest of $1,163,000), $2,099,000 (net of capitalized interest
of $1,389,000) and $2,125,000 (net of capitalized interest of $699,000) for fiscal 2008, fiscal 2007 and fiscal
2006, respectively. Interest expense, net of capitalized interest, decreased in fiscal 2008 compared to fiscal 2007
due to lower average borrowings on our credit facility during fiscal 2008 and lower average interest rates.
Capitalized interest increased in fiscal 2007 from fiscal 2006 due to an increase in interest expense in fiscal 2007
compared to fiscal 2006 resulting from borrowings under our credit facility in fiscal 2007, which did not occur in
fiscal 2006.
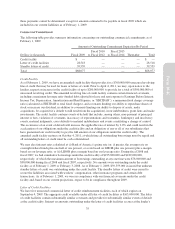
INCOME TAXES
The effective income tax rate was 28.4% for fiscal 2008 and 38.1% for fiscal 2007 and fiscal 2006. The decrease
in the effective income tax rate was primarily driven by certain favorable income tax resolutions during fiscal
2008.
We currently expect our fiscal 2009 effective tax rate to be in the range of 35% to 41%. Throughout the year, we
expect that there could be on-going variability in our quarterly tax rates as lower levels of earnings or losses can
increase the volatility of our tax rate. Additionally, our quarterly tax rate may continue to experience ongoing
variability as taxable events occur and exposures are re-evaluated.
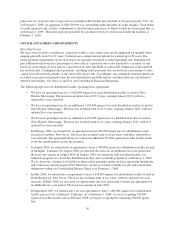
LIQUIDITY AND CAPITAL RESOURCES
As of February 1, 2009, we held $148,822,000 in cash and cash equivalent funds. Consistent with our industry,
our cash balances are seasonal in nature, with the fourth quarter representing a significantly higher level of cash
than other periods.
Throughout the fiscal year, we utilize our cash balances to build our inventory levels in preparation for our fourth
quarter holiday sales. In fiscal 2008, our cash resources were used to fund our inventory and inventory related
purchases, catalog advertising and marketing initiatives, purchases of property and equipment and dividend
payments. In addition to the current cash balances on hand, we have a $300,000,000 credit facility available as of
February 1, 2009 that may be used for loans or letters of credit. Prior to April 4, 2011, we may, upon notice to the
lenders, request an increase in the credit facility of up to $200,000,000 to provide for a total of $500,000,000 of
32