Pottery Barn 2008 Annual Report Download - page 33
Download and view the complete annual report
Please find page 33 of the 2008 Pottery Barn annual report below. You can navigate through the pages in the report by either clicking on the pages listed below, or by using the keyword search tool below to find specific information within the annual report.-
 1
1 -
2
-
3
-
4
-
5
-
6
-
7
-
8
-
9
-
10
-
11
-
12
-
13
-
14
-
15
-
16
-
17
-
18
-
19
-
20
-
21
-
22
-
 23
23 -
 24
24 -
 25
25 -
 26
26 -
 27
27 -
 28
28 -
 29
29 -
 30
30 -
 31
31 -
 32
32 -
 33
33 -
 34
34 -
 35
35 -
 36
36 -
 37
37 -
 38
38 -
 39
39 -
 40
40 -
 41
41 -
 42
42 -
 43
43 -
44
-
45
-
46
-
47
-
48
-
49
-
50
-
51
-
52
-
53
-
54
-
55
-
56
-
57
-
58
-
59
-
60
-
61
-
62
-
63
-
64
-
65
-
66
-
67
-
68
-
69
-
70
-
71
-
72
-
73
-
74
-
75
-
76
-
77
-
78
-
79
-
80
-
81
-
82
-
83
-
84
-
85
-
86
-
87
-
88
-
89
-
90
-
91
-
92
-
93
-
94
-
95
-
96
-
97
-
98
-
99
-
100
-
101
-
102
-
103
-
104
-
105
-
106
-
107
-
108
-
109
-
110
-
111
-
112
-
113
-
114
-
115
-
116
-
117
-
118
-
119
-
120
-
121
-
122
-
123
-
124
-
125
-
126
-
127
-
128
-
129
-
130
-
131
-
132
-
133
-
134
-
135
-
136
-
137
-
138
-
139
-
140
-
141
-
142
-
143
-
144
-
145
-
146
-
147
-
148
-
149
-
150
-
151
-
152
-
153
-
154
-
155
-
156
-
157
-
158
-
159
-
160
-
161
-
162
-
163
-
164
-
165
-
166
-
167
-
168
 |
 |
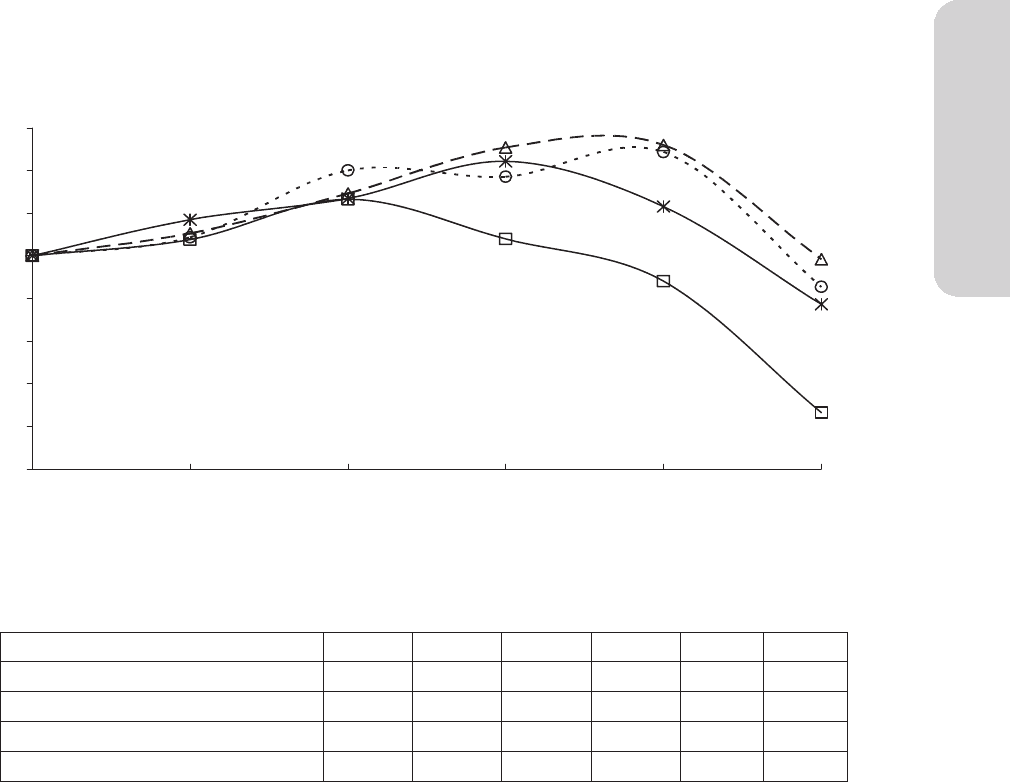
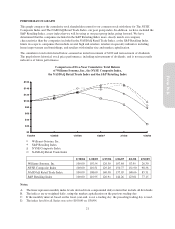
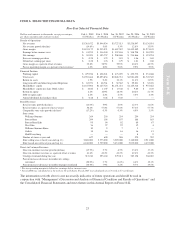
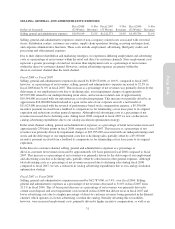
PERFORMANCE GRAPH
This graph compares the cumulative total shareholder return for our common stock with those for The NYSE
Composite Index and The NASDAQ Retail Trade Index, our peer group index. In addition, we have included the
S&P Retailing Index, a new index that we will be using as our peer group index going forward. We have
determined that the companies included in the S&P Retailing Index more closely match our company
characteristics than the companies included in the NASDAQ Retail Trade Index, as the S&P Retailing Index
limits its scope to companies that include several high end retailers, retailers in specialty industries including
home improvement and furnishings, and retailers with similar size and market capitalization.
The cumulative total return listed below assumed an initial investment of $100 and reinvestment of dividends.
The graph shows historical stock price performance, including reinvestment of dividends, and is not necessarily
indicative of future performance.
Comparison of Five-Year Cumulative Total Return
of Williams-Sonoma, Inc., the NYSE Composite Index,
the NASDAQ Retail Trade Index and the S&P Retailing Index
$0
$20
$40
$60
$80
$100
$120
$140
$160
1/30/04 1/28/05 1/27/06 1/26/07 2/1/08 1/30/09
▫Williams-Sonoma, Inc.
*S&P Retailing Index
∆NYSE Composite Index
ONASDAQ Retail Trade Index
1/30/04 1/28/05 1/27/06 1/26/07 2/1/08 1/30/09
Williams-Sonoma, Inc. 100.00 107.54 126.50 107.84 87.99 26.30
NYSE Composite Index 100.00 110.51 129.20 150.77 151.90 98.36
NASDAQ Retail Trade Index 100.00 108.60 140.08 137.03 148.66 85.31
S&P Retailing Index 100.00 116.95 126.91 144.26 123.01 77.15
Notes:
A. The lines represent monthly index levels derived from compounded daily returns that include all dividends.
B. The indices are re-weighted daily, using the market capitalization on the previous trading day.
C. If the monthly interval, based on the fiscal year-end, is not a trading day, the preceding trading day is used.
D. The index level for all Series was set to $100.00 on 1/30/04.
21
Form 10-K