Pottery Barn 2008 Annual Report Download - page 5
Download and view the complete annual report
Please find page 5 of the 2008 Pottery Barn annual report below. You can navigate through the pages in the report by either clicking on the pages listed below, or by using the keyword search tool below to find specific information within the annual report.-
 1
1 -
 2
2 -
 3
3 -
 4
4 -
 5
5 -
 6
6 -
 7
7 -
 8
8 -
 9
9 -
 10
10 -
 11
11 -
 12
12 -
 13
13 -
 14
14 -
 15
15 -
 16
16 -
17
-
18
-
19
-
20
-
21
-
22
-
23
-
24
-
25
-
26
-
27
-
28
-
29
-
30
-
31
-
32
-
33
-
34
-
35
-
36
-
37
-
38
-
39
-
40
-
41
-
42
-
43
-
44
-
45
-
46
-
47
-
48
-
49
-
50
-
51
-
52
-
53
-
54
-
55
-
56
-
57
-
58
-
59
-
60
-
61
-
62
-
63
-
64
-
65
-
66
-
67
-
68
-
69
-
70
-
71
-
72
-
73
-
74
-
75
-
76
-
77
-
78
-
79
-
80
-
81
-
82
-
83
-
84
-
85
-
86
-
87
-
88
-
89
-
90
-
91
-
92
-
93
-
94
-
95
-
96
-
97
-
98
-
99
-
100
-
101
-
102
-
103
-
104
-
105
-
106
-
107
-
108
-
109
-
110
-
111
-
112
-
113
-
114
-
115
-
116
-
117
-
118
-
119
-
120
-
121
-
122
-
123
-
124
-
125
-
126
-
127
-
128
-
129
-
130
-
131
-
132
-
133
-
134
-
135
-
136
-
137
-
138
-
139
-
140
-
141
-
142
-
143
-
144
-
145
-
146
-
147
-
148
-
149
-
150
-
151
-
152
-
153
-
154
-
155
-
156
-
157
-
158
-
159
-
160
-
161
-
162
-
163
-
164
-
165
-
166
-
167
-
168
 |
 |

A LETTER TO OUR SHAREHOLDERS
Fiscal 2008 was a year of unprecedented economic turmoil – which began with a dramatic downturn in the U.S.
housing market and ended in a full-blown recession. While no industry was immune to the impact of these
events, few were as negatively impacted as U.S. retailers – particularly in home-related categories. We, however,
had acknowledged these events early on and worked aggressively all year to put ourselves in a position of
financial strength as we entered 2009. As such, we focused on the aspects of our business we could control, and
took decisive action to reduce costs and strengthen our balance sheet.
To reduce costs, we improved advertising productivity through the optimization of catalog circulation;
implemented supply chain initiatives that lowered customer returns, replacements, and damages expenses; froze
all management salaries; and completed an infrastructure cost reduction program that will reduce operating costs
in fiscal 2009 by $75 million. As part of that program, we reduced corporate-wide full-time headcount by 18%,
closed one of our three customer care centers, and eliminated 7% of our total distribution capacity.
To strengthen our balance sheet, we reduced our inventories by $121 million; successfully amended our
unsecured $300 million revolving line of credit and $165 million unsecured letter of credit facilities; and sold
non-revenue generating assets totaling $47 million. All of these initiatives allowed us to increase our cash
balance in fiscal 2008 to $149 million, after returning over $50 million in dividends to our shareholders. We also
plan to reduce our fiscal 2009 capital commitments – particularly in the area of new stores – by nearly $100
million, while still funding those initiatives that we believe are strategic to our long-term success.
Our Fiscal 2008 Financial Results
Net revenues in fiscal 2008 – a 52-week year versus 53 weeks in fiscal 2007 – declined 15% to $3.4 billion.
Comparable store sales declined 17% and direct-to-customer revenues declined by 16%. Internet revenues – a
component of direct-to-customer revenues – declined 6%. As the Internet is one of our key future growth
vehicles, we were very encouraged by its performance in relation to the performance of our other channels. From
an earnings perspective, diluted earnings per share declined 84% to $0.28. This decline was primarily driven by
the 15% decline in net revenues, partially offset by the cost reduction initiatives discussed above. While these
results in no way reflect a level of performance we are satisfied with, they do demonstrate the flexibility of our
multi-channel business model and our organization’s ability to drive rapid change in a down-trending economy.
The Performance of Our Brands
Net revenues in our core brands – including Williams-Sonoma, Pottery Barn, and Pottery Barn Kids – declined
17%. In our emerging brands – including West Elm, PBteen, and Williams-Sonoma Home – net revenues were
relatively flat. Total retail leased square footage increased 7.1% – with the majority of the increase coming from
9 new stores in West Elm. In PBteen, our strongest performing brand, net revenues increased 3%. During the
year, our focus was on the changing demands of our customer in an environment when uncertainty was at an all
time high and consumer confidence at an all time low. These initiatives included greater product innovation,
enhancements in the value proposition and the marketing behind it, and an increase in the relevancy of our
direct-to-customer contact strategies.
Supply Chain Advancements
In our supply chain, we continued to make strategic advancements in worldwide sourcing, distribution, and
domestic and international logistics. We also reached major milestones in our furniture quality initiatives,
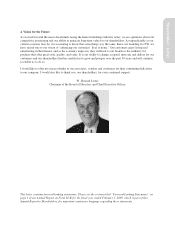
Shareholders Letter