Pottery Barn 2008 Annual Report Download - page 43
Download and view the complete annual report
Please find page 43 of the 2008 Pottery Barn annual report below. You can navigate through the pages in the report by either clicking on the pages listed below, or by using the keyword search tool below to find specific information within the annual report.-
 1
1 -
2
-
3
-
4
-
5
-
6
-
7
-
8
-
9
-
10
-
11
-
12
-
13
-
14
-
15
-
16
-
17
-
18
-
19
-
20
-
21
-
22
-
23
-
24
-
25
-
26
-
27
-
28
-
29
-
30
-
31
-
32
-
 33
33 -
 34
34 -
 35
35 -
 36
36 -
 37
37 -
 38
38 -
 39
39 -
 40
40 -
 41
41 -
 42
42 -
 43
43 -
 44
44 -
 45
45 -
 46
46 -
 47
47 -
 48
48 -
 49
49 -
 50
50 -
 51
51 -
 52
52 -
 53
53 -
54
-
55
-
56
-
57
-
58
-
59
-
60
-
61
-
62
-
63
-
64
-
65
-
66
-
67
-
68
-
69
-
70
-
71
-
72
-
73
-
74
-
75
-
76
-
77
-
78
-
79
-
80
-
81
-
82
-
83
-
84
-
85
-
86
-
87
-
88
-
89
-
90
-
91
-
92
-
93
-
94
-
95
-
96
-
97
-
98
-
99
-
100
-
101
-
102
-
103
-
104
-
105
-
106
-
107
-
108
-
109
-
110
-
111
-
112
-
113
-
114
-
115
-
116
-
117
-
118
-
119
-
120
-
121
-
122
-
123
-
124
-
125
-
126
-
127
-
128
-
129
-
130
-
131
-
132
-
133
-
134
-
135
-
136
-
137
-
138
-
139
-
140
-
141
-
142
-
143
-
144
-
145
-
146
-
147
-
148
-
149
-
150
-
151
-
152
-
153
-
154
-
155
-
156
-
157
-
158
-
159
-
160
-
161
-
162
-
163
-
164
-
165
-
166
-
167
-
168
 |
 |

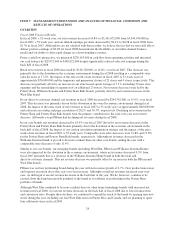
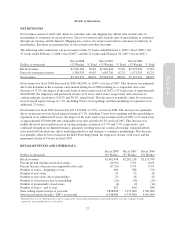
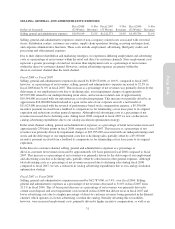
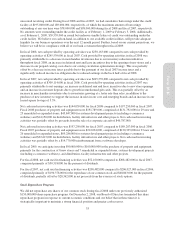
SELLING, GENERAL AND ADMINISTRATIVE EXPENSES
Dollars in thousands
Fiscal 2008
(52 Weeks)
% Net
Revenues
Fiscal 2007
(53 Weeks)
% Net
Revenues
Fiscal 2006
(52 Weeks)
% Net
Revenues
Selling, general and administrative expenses $1,093,019 32.5% $1,222,573 31.0% $1,159,786 31.1%
Selling, general and administrative expenses consist of non-occupancy related costs associated with our retail
stores, distribution centers, customer care centers, supply chain operations (buying, receiving and inspection),
and corporate administrative functions. These costs include employment, advertising, third party credit card
processing and other general expenses.
Due to their distinct distribution and marketing strategies, we experience differing employment and advertising
costs as a percentage of net revenues within the retail and direct-to-customer channels. Store employment costs
represent a greater percentage of retail net revenues than employment costs as a percentage of net revenues
within the direct-to-customer channel. However, catalog advertising expenses are greater within the
direct-to-customer channel than the retail channel.
Fiscal 2008 vs. Fiscal 2007
Selling, general and administrative expenses decreased by $129,554,000, or 10.6%, compared to fiscal 2007,
however, as a percentage of net revenues, selling, general and administrative expenses increased to 32.5% in
fiscal 2008 from 31.0% in fiscal 2007. This increase as a percentage of net revenues was primarily driven by the
deleverage of our employment costs due to declining sales, asset impairment charges of approximately
$33,995,000 related to our underperforming retail stores, and severance related costs of approximately
$10,344,000 associated with our infrastructure cost reduction program. This increase was partially offset by an
approximate $16,000,000 benefit related to a gain on the sale of our corporate aircraft, a net benefit of
$11,023,000 associated with the reversal of performance-based stock compensation expense, a $9,350,000
incentive payment received from a landlord to compensate us for terminating a store lease prior to its original
expiration and reductions in other general expenses. Although total advertising costs as a percentage of net
revenues increased due to declining sales, during fiscal 2008 compared to fiscal 2007 we saw a reduction in
catalog advertising expenditures due to our catalog circulation optimization strategy.
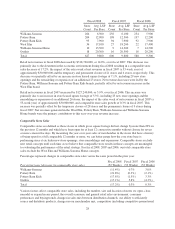
In the retail channel, selling, general and administrative expenses as a percentage of retail net revenues increased
approximately 230 basis points in fiscal 2008 compared to fiscal 2007. This increase as a percentage of net
revenues was primarily driven by impairment charges of $33,995,000 associated with our underperforming retail
stores and the deleverage of our employment costs due to declining sales, partially offset by a $9,350,000
incentive payment received from a landlord to compensate us for terminating a store lease prior to its original
expiration.
In the direct-to-customer channel, selling, general and administrative expenses as a percentage of
direct-to-customer net revenues increased by approximately 120 basis points in fiscal 2008 compared to fiscal
2007. This increase as a percentage of net revenues was primarily driven by the deleverage of our employment
and advertising costs due to declining sales, partially offset by reductions in other general expenses. Although
total advertising costs as a percentage of net revenues increased due to declining sales during fiscal 2008
compared to fiscal 2007, we saw a reduction in catalog advertising expenditures due to our catalog circulation
optimization strategy.
Fiscal 2007 vs. Fiscal 2006
Selling, general and administrative expenses increased by $62,787,000, or 5.4%, over fiscal 2006. Selling,
general and administrative expenses as a percentage of net revenues decreased to 31.0% in fiscal 2007 from
31.1% in fiscal 2006. This 10 basis point decrease as a percentage of net revenues was primarily driven by
certain asset disposal and asset impairment costs incurred in fiscal 2006 that did not recur in fiscal 2007 and
lower advertising costs due to a higher percentage of direct-to-customer revenues being generated in the Internet
channel, which operates at a lower advertising cost than the catalog. Partially offsetting this favorability,
however, were increased employment costs, primarily driven by higher incentive compensation, as well as an
31
Form 10-K