Pottery Barn 2008 Annual Report Download - page 68
Download and view the complete annual report
Please find page 68 of the 2008 Pottery Barn annual report below. You can navigate through the pages in the report by either clicking on the pages listed below, or by using the keyword search tool below to find specific information within the annual report.-
 1
1 -
2
-
3
-
4
-
5
-
6
-
7
-
8
-
9
-
10
-
11
-
12
-
13
-
14
-
15
-
16
-
17
-
18
-
19
-
20
-
21
-
22
-
23
-
24
-
25
-
26
-
27
-
28
-
29
-
30
-
31
-
32
-
33
-
34
-
35
-
36
-
37
-
38
-
39
-
40
-
41
-
42
-
43
-
44
-
45
-
46
-
47
-
48
-
49
-
50
-
51
-
52
-
53
-
54
-
55
-
56
-
57
-
 58
58 -
 59
59 -
 60
60 -
 61
61 -
 62
62 -
 63
63 -
 64
64 -
 65
65 -
 66
66 -
 67
67 -
 68
68 -
 69
69 -
 70
70 -
 71
71 -
 72
72 -
 73
73 -
 74
74 -
 75
75 -
 76
76 -
 77
77 -
 78
78 -
79
-
80
-
81
-
82
-
83
-
84
-
85
-
86
-
87
-
88
-
89
-
90
-
91
-
92
-
93
-
94
-
95
-
96
-
97
-
98
-
99
-
100
-
101
-
102
-
103
-
104
-
105
-
106
-
107
-
108
-
109
-
110
-
111
-
112
-
113
-
114
-
115
-
116
-
117
-
118
-
119
-
120
-
121
-
122
-
123
-
124
-
125
-
126
-
127
-
128
-
129
-
130
-
131
-
132
-
133
-
134
-
135
-
136
-
137
-
138
-
139
-
140
-
141
-
142
-
143
-
144
-
145
-
146
-
147
-
148
-
149
-
150
-
151
-
152
-
153
-
154
-
155
-
156
-
157
-
158
-
159
-
160
-
161
-
162
-
163
-
164
-
165
-
166
-
167
-
168
 |
 |

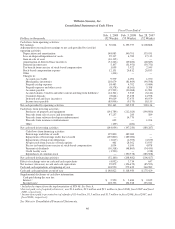
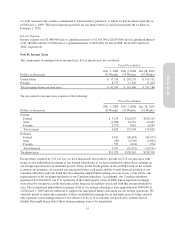
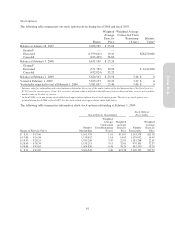
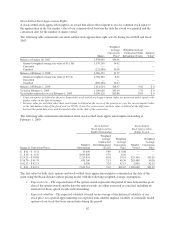
A reconciliation of income taxes at the federal statutory corporate rate to the effective rate is as follows:
Fiscal Year Ended
Feb. 1, 2009
(52 Weeks)
Feb. 3, 2008
(53 Weeks)
Jan. 28, 2007
(52 Weeks)
Federal income taxes at the statutory rate 35.0% 35.0% 35.0%
State income tax rate (8.2%) 3.5% 4.0%
Other 1.6% (0.4%) (0.9%)
Total 28.4%138.1% 38.1%
1The decrease in the fiscal 2008 effective income tax rate was primarily driven by certain favorable income tax resolutions during fiscal
2008.
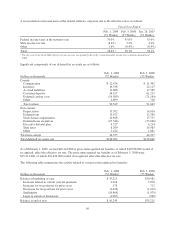
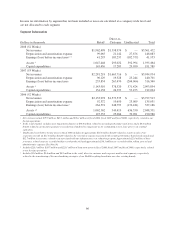
Significant components of our deferred tax accounts are as follows:
Dollars in thousands
Feb. 1, 2009
(52 Weeks)
Feb. 3, 2008
(53 Weeks)
Current:
Compensation $ 12,436 $ 11,392
Inventory 19,538 22,117
Accrued liabilities 11,868 17,585
Customer deposits 58,197 61,215
Deferred catalog costs (14,589) (21,184)
Other 2,899 718
Total current 90,349 91,843
Non-current:
Depreciation 13,392 14,616
Deferred rent 15,672 12,390
Stock-based compensation 20,828 17,757
Deferred lease incentives (27,548) (23,046)
Executive deferral plan 4,527 6,214
State taxes 8,260 15,985
Other 1,424 1,081
Total non-current 36,555 44,997
Total deferred tax assets, net $126,904 $136,840
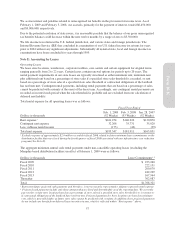
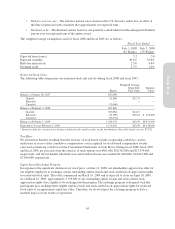
As of February 1, 2009, we had $16,243,000 of gross unrecognized tax benefits, of which $10,558,000 would, if
recognized, affect the effective tax rate. The gross unrecognized tax benefits as of February 3, 2008 were
$35,211,000, of which $22,634,000 would, if recognized, affect the effective tax rate.
The following table summarizes the activity related to our gross unrecognized tax benefits:
Dollars in thousands
Feb. 1, 2009
(52 Weeks)
Feb. 3, 2008
(53 Weeks)
Balance at beginning of year $ 35,211 $30,981
Increases related to current year tax positions 2,018 7,076
Increases for tax positions for prior years 178 712
Decreases for tax positions for prior years (1,628) (1,010)
Settlements (18,469) (1,979)
Lapse in statute of limitations (1,067) (569)
Balance at end of year $ 16,243 $35,211
56