Pottery Barn 2008 Annual Report Download - page 117
Download and view the complete annual report
Please find page 117 of the 2008 Pottery Barn annual report below. You can navigate through the pages in the report by either clicking on the pages listed below, or by using the keyword search tool below to find specific information within the annual report.-
 1
1 -
2
-
3
-
4
-
5
-
6
-
7
-
8
-
9
-
10
-
11
-
12
-
13
-
14
-
15
-
16
-
17
-
18
-
19
-
20
-
21
-
22
-
23
-
24
-
25
-
26
-
27
-
28
-
29
-
30
-
31
-
32
-
33
-
34
-
35
-
36
-
37
-
38
-
39
-
40
-
41
-
42
-
43
-
44
-
45
-
46
-
47
-
48
-
49
-
50
-
51
-
52
-
53
-
54
-
55
-
56
-
57
-
58
-
59
-
60
-
61
-
62
-
63
-
64
-
65
-
66
-
67
-
68
-
69
-
70
-
71
-
72
-
73
-
74
-
75
-
76
-
77
-
78
-
79
-
80
-
81
-
82
-
83
-
84
-
85
-
86
-
87
-
88
-
89
-
90
-
91
-
92
-
93
-
94
-
95
-
96
-
97
-
98
-
99
-
100
-
101
-
102
-
103
-
104
-
105
-
106
-
 107
107 -
 108
108 -
 109
109 -
 110
110 -
 111
111 -
 112
112 -
 113
113 -
 114
114 -
 115
115 -
 116
116 -
 117
117 -
 118
118 -
 119
119 -
 120
120 -
 121
121 -
 122
122 -
 123
123 -
 124
124 -
 125
125 -
 126
126 -
 127
127 -
128
-
129
-
130
-
131
-
132
-
133
-
134
-
135
-
136
-
137
-
138
-
139
-
140
-
141
-
142
-
143
-
144
-
145
-
146
-
147
-
148
-
149
-
150
-
151
-
152
-
153
-
154
-
155
-
156
-
157
-
158
-
159
-
160
-
161
-
162
-
163
-
164
-
165
-
166
-
167
-
168
 |
 |

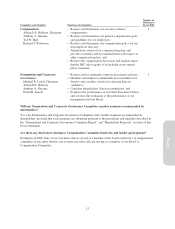
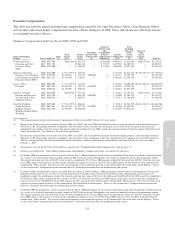
Executive Compensation
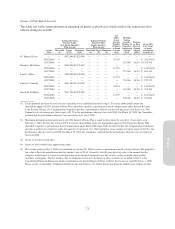
This table sets forth the annual and long-term compensation earned by our Chief Executive Officer, Chief Financial Officer
and our three other most highly compensated executive officers during fiscal 2008. These individuals are collectively known
as our named executive officers.
Summary Compensation Table for Fiscal 2008, 2007 and 2006
Name and Principal
Position Year(1) Salary ($)
Bonus
(S)
Stock
Awards
($)(2)
Option
Awards
($)(3)
Non-Equity
Incentive Plan
Compensation
($)
Change in
Pension Value
and
Nonqualified
Deferred
Compensation
Earnings(4)
All Other
Compensation
($)(5)
Total
Excluding
Reversed
Stock
Award
Expense
($)
Reversed
Stock
Award
Expense
($)(2) Total ($)
W. Howard Lester ........
Chairman and Chief
Executive Officer
(PEO)
2008
2007
2006
$975,000
$993,750
$975,000
—
—
—
$85,032(6)
—
—
$1,905,747
$2,981,381
$ 264,891
—
—
—
<$238,669>
$ 55,279
$ 23,094
$700,874
$479,507
$366,400
$3,427,984
$4,509,917
$1,629,385
<$60,153>(6)
—
—
$3,367,831
$4,509,917
$1,629,385
Sharon L. McCollam ...... 2008 $725,000 — $ 971,219(7) $ 726,787 — — $ 88,330 $2,511,336 <$3,631,287>(7) <$1,119,951>
Executive Vice President, 2007 $738,942 — $1,423,878 $ 873,653 $200,000 — $ 84,277 $3,320,750 — $3,320,750
Chief Operating and Chief
Financial Officer (PFO)
2006 $621,212 — $1,193,509 $ 718,853 — — $ 60,820 $2,594,394 — $2,594,394
Laura J. Alber ............ 2008 $800,000 — $ 971,219(7) $ 741,092 — — $ 88,078 $2,600,389 <$3,631,287>(7) <$1,030,898>
President 2007 $815,385 — $1,423,878 $ 765,213 $150,000 — $ 84,268 $3,238,744 — $3,238,744
2006 $700,770 — $1,193,509 $ 700,867 — — $ 58,803 $2,653,949 — $2,653,949
Patrick J. Connolly ........
Director and Executive
Vice President, Chief
Marketing Officer
2008
2007
2006
$570,000
$578,769
$566,538
—
—
—
$28,867(8)
—
—
$ 573,722
$ 602,410
$ 585,971
—
$100,000
—
—
—
—
$ 19,222
$ 19,900
$ 16,431
$1,191,811
$1,301,079
$1,168,940
<$18,915>(8)
—
—
$1,172,896
$1,301,079
$1,168,940
David M. DeMattei ....... 2008 $675,000 — $ 971,219(7) $ 804,634 — — $ 93,654 $2,544,507 <$3,631,287>(7) <$1,086,780>
Group President, 2007 $687,981 — $1,423,878 $1,127,527 $125,000 — $ 84,506 $3,448,892 — $3,448,892
Williams-Sonoma,
Williams-Sonoma Home,
West Elm
2006 $614,596 — $1,193,509 $1,056,698 — — $ 59,209 $2,924,012 — $2,924,012
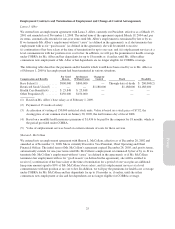
(1) The compensation reflected in the Summary Compensation Table for fiscal 2007 reflects a 53-week period.
(2) Based on the compensation cost recognized in fiscal 2008, fiscal 2007, and fiscal 2006 for financial statement reporting purposes as determined pursuant to
SFAS No. 123R, disregarding forfeiture assumptions. The fair market value is based on the closing price of our stock on the day prior to the grant date
multiplied by the number of awards issued. The amount under this column for fiscal 2008 excludes the amounts disclosed under the column titled “Reversed
Stock Award Expense.” See footnote 5 for a detailed explanation.
(3) Based on the compensation cost recognized in fiscal 2008, fiscal 2007, and fiscal 2006 for financial statement reporting purposes as determined pursuant to
SFAS No. 123R, disregarding forfeiture assumptions. The fair market value assumptions used in the calculation of these amounts for fiscal 2008 and fiscal
2007 are included in Note I to our Consolidated Financial Statements, which is included in our Annual Report on Form 10-K for the fiscal year ended
February 1, 2009.
(4) Total income (loss) in the Executive Deferral Plan as shown in the “Nonqualified Deferred Compensation” table on page 24.
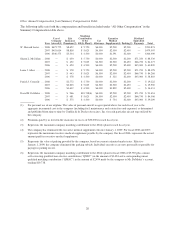
(5) Details are provided in the “Other Annual Compensation from Summary Compensation Table” provided on the next page.
(6) In October 2008, the performance criteria associated with the May 2, 2008 performance-based award was determined to no longer be probable of being achieved.
As a result, we reversed all previously recorded expense of $60,153 for this award. Subsequently, the award was modified to remove the performance criteria.
The original grant date fair value of $26.85 for the award was modified to $9.44. Fiscal 2008 expense recorded for this award was $85,032. Therefore, the total
fiscal 2008 expense with respect to all stock awards, including the expense reversal, was $24,879. Fiscal 2008 expense for this award has been reportedinthe
column titled “Stock Awards.” The reversed stock award expense has been reported separately, in the column titled “Reversed Stock Award Expense.” Please
see the section titled “Compensation Discussion and Analysis” for further discussion about the modification of this award.
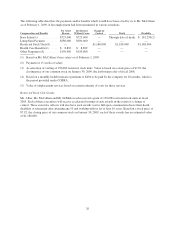
(7) In October 2008, the performance criteria associated with the January 6, 2006 and May 2, 2008 performance-based awards were determined to no longerbe
probable of being achieved. As a result, we reversed all previously recorded expense of $3,631,287 for both awards. Subsequently, these awards were
modified to remove the performance criteria. The original grant date fair values of $42.18 for the 2006 award and $26.85 for the 2008 award were modifiedto
$9.44. Fiscal 2008 expense recorded for these awards was $971,219. Therefore, the total fiscal 2008 expense with respect to all stock awards, including the
expense reversal, was <$2,660,068>. Fiscal 2008 expense for these awards has been reported in the column titled “Stock Awards.” The reversed stock award
expense has been reported separately, in the column titled “Reversed Stock Award Expense.” Please see the section titled “Compensation Discussion and
Analysis” for further discussion about the modification of these awards.
(8) In October 2008, the performance criteria associated with the May 2, 2008 performance-based award was determined to no longer be probable of being achieved.
As a result, we reversed all previously recorded expense of $18,915 for this award. Subsequently, the award was modified to remove the performance criteria.
The original grant date fair value of $26.85 for the award was modified to $9.44. Fiscal 2008 expense recorded for this award was $28,867. Therefore, the total
fiscal 2008 expense with respect to all stock awards, including the expense reversal, was $9,952. Fiscal 2008 expense for this award has been reported in the
column titled “Stock Awards.” The reversed stock award expense has been reported separately, in the column titled “Reversed Stock Award Expense.” Please
see the section titled “Compensation Discussion and Analysis” for further discussion about the modification of this award.
19
Proxy