Pottery Barn 2008 Annual Report Download - page 57
Download and view the complete annual report
Please find page 57 of the 2008 Pottery Barn annual report below. You can navigate through the pages in the report by either clicking on the pages listed below, or by using the keyword search tool below to find specific information within the annual report.-
 1
1 -
2
-
3
-
4
-
5
-
6
-
7
-
8
-
9
-
10
-
11
-
12
-
13
-
14
-
15
-
16
-
17
-
18
-
19
-
20
-
21
-
22
-
23
-
24
-
25
-
26
-
27
-
28
-
29
-
30
-
31
-
32
-
33
-
34
-
35
-
36
-
37
-
38
-
39
-
40
-
41
-
42
-
43
-
44
-
45
-
46
-
 47
47 -
 48
48 -
 49
49 -
 50
50 -
 51
51 -
 52
52 -
 53
53 -
 54
54 -
 55
55 -
 56
56 -
 57
57 -
 58
58 -
 59
59 -
 60
60 -
 61
61 -
 62
62 -
 63
63 -
 64
64 -
 65
65 -
 66
66 -
 67
67 -
68
-
69
-
70
-
71
-
72
-
73
-
74
-
75
-
76
-
77
-
78
-
79
-
80
-
81
-
82
-
83
-
84
-
85
-
86
-
87
-
88
-
89
-
90
-
91
-
92
-
93
-
94
-
95
-
96
-
97
-
98
-
99
-
100
-
101
-
102
-
103
-
104
-
105
-
106
-
107
-
108
-
109
-
110
-
111
-
112
-
113
-
114
-
115
-
116
-
117
-
118
-
119
-
120
-
121
-
122
-
123
-
124
-
125
-
126
-
127
-
128
-
129
-
130
-
131
-
132
-
133
-
134
-
135
-
136
-
137
-
138
-
139
-
140
-
141
-
142
-
143
-
144
-
145
-
146
-
147
-
148
-
149
-
150
-
151
-
152
-
153
-
154
-
155
-
156
-
157
-
158
-
159
-
160
-
161
-
162
-
163
-
164
-
165
-
166
-
167
-
168
 |
 |

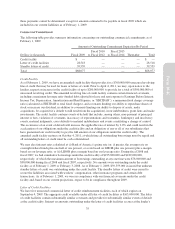
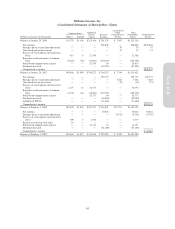
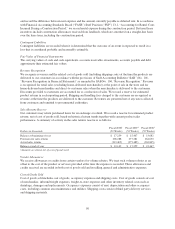
Williams-Sonoma, Inc.
Consolidated Statements of Shareholders’ Equity
Common Stock Additional
Paid-in
Capital
Retained
Earnings
Accumulated
Other
Comprehensive
Income
Total
Shareholders’
Equity
Comprehensive
IncomeDollars and shares in thousands Shares Amount
Balance at January 29, 2006 114,779 $1,148 $325,146 $ 791,329 $ 7,695 $1,125,318
Net earnings — — — 208,868 — 208,868 $208,868
Foreign currency translation adjustment — — — — 76 76 76
Unrealized gain on investment — — — — 13 13 13
Exercise of stock options and related tax
effect 913 9 21,349 — — 21,358
Repurchase and retirement of common
stock (5,824) (58) (15,031) (170,419) — (185,508)
Stock-based compensation expense — — 26,759 54 — 26,813
Dividends declared — — — (45,507) — (45,507)
Comprehensive income $208,957
Balance at January 28, 2007 109,868 $1,099 $358,223 $ 784,325 $ 7,784 $1,151,431
Net earnings — — — 195,757 — 195,757 195,757
Foreign currency translation adjustment — — — — 7,482 7,482 7,482
Unrealized loss on investment — — — — (15) (15) (15)
Exercise of stock options and related tax
effect 1,677 16 36,337 — — 36,353
Repurchase and retirement of common
stock (6,196) (61) (18,060) (172,257) — (190,378)
Stock-based compensation expense 26,717 60 — 26,777
Dividends declared — — — (50,000) — (50,000)
Adoption of FIN 48 — — — (11,684) — (11,684)
Comprehensive income $203,224
Balance at February 3, 2008 105,349 $1,054 $403,217 $ 746,201 $15,251 $1,165,723
Net earnings — — — 30,024 — 30,024 30,024
Foreign currency translation adjustment — — — — (9,742) (9,742) (9,742)
Exercise of stock options and related tax
effect 299 3 1,034 — — 1,037
Release of restricted stock units 16 — — — — —
Stock-based compensation expense — — 12,115 16 — 12,131
Dividends declared — — — (51,189) — (51,189)
Comprehensive income $ 20,282
Balance at February 1, 2009 105,664 $1,057 $416,366 $ 725,052 $ 5,509 $1,147,984
45
Form 10-K