Pottery Barn 2008 Annual Report Download - page 58
Download and view the complete annual report
Please find page 58 of the 2008 Pottery Barn annual report below. You can navigate through the pages in the report by either clicking on the pages listed below, or by using the keyword search tool below to find specific information within the annual report.-
 1
1 -
2
-
3
-
4
-
5
-
6
-
7
-
8
-
9
-
10
-
11
-
12
-
13
-
14
-
15
-
16
-
17
-
18
-
19
-
20
-
21
-
22
-
23
-
24
-
25
-
26
-
27
-
28
-
29
-
30
-
31
-
32
-
33
-
34
-
35
-
36
-
37
-
38
-
39
-
40
-
41
-
42
-
43
-
44
-
45
-
46
-
47
-
 48
48 -
 49
49 -
 50
50 -
 51
51 -
 52
52 -
 53
53 -
 54
54 -
 55
55 -
 56
56 -
 57
57 -
 58
58 -
 59
59 -
 60
60 -
 61
61 -
 62
62 -
 63
63 -
 64
64 -
 65
65 -
 66
66 -
 67
67 -
 68
68 -
69
-
70
-
71
-
72
-
73
-
74
-
75
-
76
-
77
-
78
-
79
-
80
-
81
-
82
-
83
-
84
-
85
-
86
-
87
-
88
-
89
-
90
-
91
-
92
-
93
-
94
-
95
-
96
-
97
-
98
-
99
-
100
-
101
-
102
-
103
-
104
-
105
-
106
-
107
-
108
-
109
-
110
-
111
-
112
-
113
-
114
-
115
-
116
-
117
-
118
-
119
-
120
-
121
-
122
-
123
-
124
-
125
-
126
-
127
-
128
-
129
-
130
-
131
-
132
-
133
-
134
-
135
-
136
-
137
-
138
-
139
-
140
-
141
-
142
-
143
-
144
-
145
-
146
-
147
-
148
-
149
-
150
-
151
-
152
-
153
-
154
-
155
-
156
-
157
-
158
-
159
-
160
-
161
-
162
-
163
-
164
-
165
-
166
-
167
-
168
 |
 |

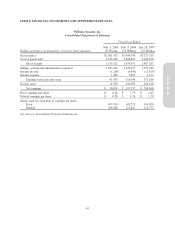
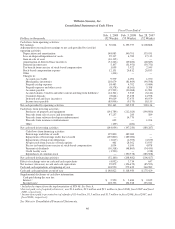
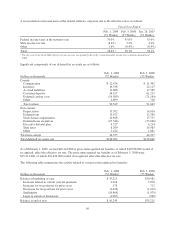
Williams-Sonoma, Inc.
Consolidated Statements of Cash Flows
Fiscal Year Ended
Dollars in thousands
Feb. 1, 2009
(52 Weeks)
Feb. 3, 2008
(53 Weeks)
Jan. 28, 2007
(52 Weeks)
Cash flows from operating activities:
Net earnings $ 30,024 $ 195,757 $ 208,868
Adjustments to reconcile net earnings to net cash provided by (used in)
operating activities:
Depreciation and amortization 148,083 140,701 135,031
Loss on disposal/impairment of assets 39,317 4,700 17,113
Gain on sale of asset (16,115) — —
Amortization of deferred lease incentives (31,266) (29,400) (28,683)
Deferred income taxes 5,107 (31,951) (50,751)
Tax benefit from exercise of stock-based compensation 1,059 3,922 2,545
Stock-based compensation expense 12,131 26,812 26,813
Other (416) — —
Changes in:
Accounts receivable 9,579 2,091 1,070
Merchandise inventories 118,679 (81,469) (90,598)
Prepaid catalog expenses 18,483 4,702 (5,684)
Prepaid expenses and other assets (8,578) (8,161) 5,398
Accounts payable (27,532) (30,068) 11,981
Accrued salaries, benefits and other current and long term liabilities1(24,361) 5,945 (6,141)
Customer deposits (8,644) 13,458 14,958
Deferred rent and lease incentives 49,619 37,675 49,079
Income taxes payable (85,006) (9,175) 18,115
Net cash provided by operating activities 230,163 245,539 309,114
Cash flows from investing activities:
Purchases of property and equipment (191,789) (212,024) (190,980)
Proceeds from sale of assets and investments 47,257 285 589
Proceeds from software developer reimbursement — 14,770 —
Proceeds from insurance reimbursement 632 — 1,104
Other (139) (281) —
Net cash used in investing activities (144,039) (197,250) (189,287)
Cash flows from financing activities:
Borrowings under line of credit 195,800 189,000 —
Repayments of borrowings under line of credit (195,800) (189,000) —
Repayments of long-term obligations (1,617) (2,703) (4,679)
Net proceeds from exercise of stock options 461 28,362 13,935
Excess tax benefit from exercise of stock-based compensation 1,034 5,100 4,878
Payment of dividends (50,518) (48,863) (34,435)
Credit facility costs (1,520) — (218)
Repurchases of common stock — (190,378) (185,508)
Net cash used in financing activities (52,160) (208,482) (206,027)
Effect of exchange rates on cash and cash equivalents (4,092) 3,714 647
Net increase (decrease) in cash and cash equivalents 29,872 (156,479) (85,553)
Cash and cash equivalents at beginning of year 118,950 275,429 360,982
Cash and cash equivalents at end of year $ 148,822 $ 118,950 $ 275,429
Supplemental disclosure of cash flow information:
Cash paid during the year for:
Interest 2$ 2,550 $ 3,484 $ 2,815
Income taxes3118,356 154,948 155,041
1Includes the impact from the implementation of FIN 48. See Note A.
2Interest paid, net of capitalized interest, was $1.4 million, $2.1 million and $2.1 million in fiscal 2008, fiscal 2007 and fiscal
2006, respectively.
3Income taxes paid is presented net of refunds of $1.4 million, $1.5 million and $1.7 million in fiscal 2008, fiscal 2007, and
fiscal 2006, respectively.
See Notes to Consolidated Financial Statements.
46