Pottery Barn 2008 Annual Report Download - page 39
Download and view the complete annual report
Please find page 39 of the 2008 Pottery Barn annual report below. You can navigate through the pages in the report by either clicking on the pages listed below, or by using the keyword search tool below to find specific information within the annual report.-
 1
1 -
2
-
3
-
4
-
5
-
6
-
7
-
8
-
9
-
10
-
11
-
12
-
13
-
14
-
15
-
16
-
17
-
18
-
19
-
20
-
21
-
22
-
23
-
24
-
25
-
26
-
27
-
28
-
 29
29 -
 30
30 -
 31
31 -
 32
32 -
 33
33 -
 34
34 -
 35
35 -
 36
36 -
 37
37 -
 38
38 -
 39
39 -
 40
40 -
 41
41 -
 42
42 -
 43
43 -
 44
44 -
 45
45 -
 46
46 -
 47
47 -
 48
48 -
 49
49 -
50
-
51
-
52
-
53
-
54
-
55
-
56
-
57
-
58
-
59
-
60
-
61
-
62
-
63
-
64
-
65
-
66
-
67
-
68
-
69
-
70
-
71
-
72
-
73
-
74
-
75
-
76
-
77
-
78
-
79
-
80
-
81
-
82
-
83
-
84
-
85
-
86
-
87
-
88
-
89
-
90
-
91
-
92
-
93
-
94
-
95
-
96
-
97
-
98
-
99
-
100
-
101
-
102
-
103
-
104
-
105
-
106
-
107
-
108
-
109
-
110
-
111
-
112
-
113
-
114
-
115
-
116
-
117
-
118
-
119
-
120
-
121
-
122
-
123
-
124
-
125
-
126
-
127
-
128
-
129
-
130
-
131
-
132
-
133
-
134
-
135
-
136
-
137
-
138
-
139
-
140
-
141
-
142
-
143
-
144
-
145
-
146
-
147
-
148
-
149
-
150
-
151
-
152
-
153
-
154
-
155
-
156
-
157
-
158
-
159
-
160
-
161
-
162
-
163
-
164
-
165
-
166
-
167
-
168
 |
 |

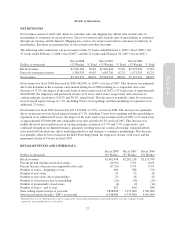
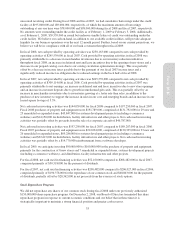
Results of Operations
NET REVENUES
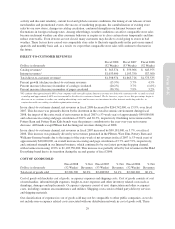
Net revenues consist of retail sales, direct-to-customer sales and shipping fees. Retail sales include sales of
merchandise to customers at our retail stores. Direct-to-customer sales include sales of merchandise to customers
through our catalogs and the Internet. Shipping fees consist of revenue received from customers for delivery of
merchandise. Revenues are presented net of sales returns and other discounts.
The following table summarizes our net revenues for the 52 weeks ended February 1, 2009 (“fiscal 2008”), the
53 weeks ended February 3, 2008 (“fiscal 2007”) and the 52 weeks ended January 28, 2007 (“fiscal 2006”):
Dollars in thousands
Fiscal 2008
(52 Weeks) % Total
Fiscal 2007
(53 Weeks) % Total
Fiscal 2006
(52 Weeks) % Total
Retail revenues $1,962,498 58.4% $2,281,218 57.8% $2,153,978 57.8%
Direct-to-customer revenues 1,398,974 41.6% 1,663,716 42.2% 1,573,535 42.2%
Net revenues $3,361,472 100.0% $3,944,934 100.0% $3,727,513 100.0%
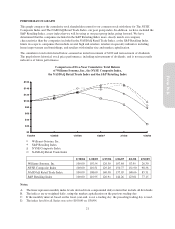
Net revenues for fiscal 2008 decreased by $583,462,000, or 14.8%, over fiscal 2007. This decrease was primarily
due to the downturn in the economic environment during fiscal 2008 resulting in a comparable store sales
decrease of 17.2%, the impact of the extra week of net revenues in fiscal 2007 (a 53-week year) of approximately
$70,000,000, the temporary and permanent closure of 21 stores and 4 stores, respectively and a decrease in
catalog and page circulation of 20.2% and 30.3%, respectively. This decrease was partially offset by an increase
in store leased square footage of 7.1% (including 29 new store openings and the remodeling or expansion of an
additional 23 stores).
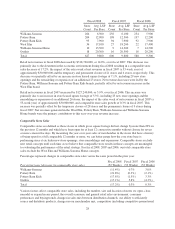
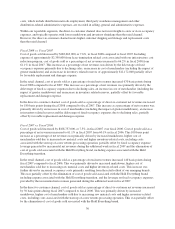
Net revenues for fiscal 2007 increased by $217,421,000, or 5.8%, over fiscal 2006. This increase was primarily
due to an increase in store leased square footage of 5.3%, including 23 new store openings and the remodeling or
expansion of an additional 26 stores, the impact of the extra week of net revenues in fiscal 2007 (a 53-week year)
of approximately $70,000,000 and comparable store sales growth of 0.3% in fiscal 2007. This increase was
further driven by an overall increase in catalog and page circulation of 3.7% and 7.9%, respectively, and
continued strength in our Internet business, primarily resulting from our catalog advertising, expanded efforts
associated with our electronic direct marketing initiatives and strategic e-commerce partnerships. This increase
was partially offset by lost revenues in the Hold Everything brand, the temporary closure of 28 stores and the
permanent closure of 9 stores in fiscal 2007.
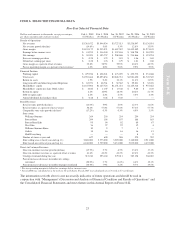
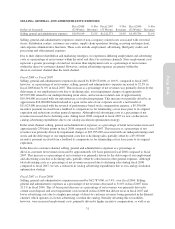
RETAIL REVENUES AND OTHER DATA
Dollars in thousands
Fiscal 2008
(52 Weeks)
Fiscal 2007
(53 Weeks)
Fiscal 2006
(52 Weeks)
Retail revenues $1,962,498 $2,281,218 $2,153,978
Percent growth (decline) in retail revenues (14.0%) 5.9% 6.0%
Percent increase (decrease) in comparable store sales (17.2%) 0.3% 0.3%
Number of stores – beginning of year 600 588 570
Number of new stores 29 23 28
Number of new stores due to remodeling123 26 28
Number of closed stores due to remodeling1(21) (28) (24)
Number of permanently closed stores (4) (9) (14)
Number of stores – end of year 627 600 588
Store selling square footage at year-end 3,828,000 3,575,000 3,389,000
Store leased square footage (“LSF”) at year-end 6,148,000 5,739,000 5,451,000
1Remodeled stores are defined as those stores temporarily closed and subsequently reopened during the year due to square footage
expansion, store modification or relocation.
27
Form 10-K